Advertisements
Online Mock Tests
Chapters
2: Polynomials
3: Pair of Linear Equations in Two Variables
4: Quadratic Equations
5: Arithmetic Progression
6: Co-Ordinate Geometry
7: Triangles
8: Circles
9: Constructions
10: Trigonometric Ratios
11: Trigonometric Identities
12: Trigonometry
13: Areas Related to Circles
14: Surface Areas and Volumes
▶ 15: Statistics
16: Probability
![RD Sharma solutions for Mathematics [English] Class 10 chapter 15 - Statistics - Shaalaa.com](/images/8193647920-mathematics-english-class-10_6:5809898a5fef45e9a2f7e6b414d392fa.jpg "RD Sharma solutions for Mathematics [English] Class 10 chapter 15 - Statistics")
Advertisements
Solutions for Chapter 15: Statistics
Below listed, you can find solutions for Chapter 15 of CBSE RD Sharma for Mathematics [English] Class 10.
RD Sharma solutions for Mathematics [English] Class 10 15 Statistics Exercise 15.1 [Pages 5 - 6]
Calculate the mean for the following distribution:-
| x | 5 | 6 | 7 | 8 | 9 |
| f | 4 | 8 | 14 | 11 | 3 |
Find the mean of the following data:-
| x | 19 | 21 | 23 | 25 | 27 | 29 | 31 |
| f | 13 | 15 | 16 | 18 | 16 | 15 | 13 |
If the mean of the following data is 20.6. Find the value of p.
| x | 10 | 15 | P | 25 | 35 |
| f | 3 | 10 | 25 | 7 | 5 |
If the mean of the following data is 15, find p.
| x | 5 | 10 | 15 | 20 | 25 |
| f | 6 | P | 6 | 10 | 5 |
Find the value of p for the following distribution whose mean is 16.6
| x | 8 | 12 | 15 | P | 20 | 25 | 30 |
| f | 12 | 16 | 20 | 24 | 16 | 8 | 4 |
Find the missing value of p for the following distribution whose mean is 12.58
| x | 5 | 8 | 10 | 12 | P | 20 | 25 |
| f | 2 | 5 | 8 | 22 | 7 | 4 | 2 |
Find the missing frequency (p) for the following distribution whose mean is 7.68.
| x | 3 | 5 | 7 | 9 | 11 | 13 |
| f | 6 | 8 | 15 | P | 8 | 4 |
The following table gives the number of boys of a particular age in a class of 40 students. Calculate the mean age of the students
| Age (in years) | 15 | 16 | 17 | 18 | 19 | 20 |
| No. of students | 3 | 8 | 10 | 10 | 5 | 4 |
Candidates of four schools appear in a mathematics test. The data were as follows:-
| Schools | No. of Candidates | Average Score |
| I | 60 | 75 |
| II | 48 | 80 |
| III | NA | 55 |
| IV | 40 | 50 |
If the average score of the candidates of all the four schools is 66, find the number of candidates that appeared from school III.
Five coins were simultaneously tossed 1000 times and at each toss the number of heads were observed. The number of tosses during which 0, 1, 2, 3, 4 and 5 heads were obtained are shown in the table below. Find the mean number of heads per toss.
| No. of heads per toss | No. of tosses |
| 0 | 38 |
| 1 | 144 |
| 2 | 342 |
| 3 | 287 |
| 4 | 164 |
| 5 | 25 |
| Total | 1000 |
The arithmetic mean of the following data is 14. Find the value of k
| x1 | 5 | 10 | 15 | 20 | 25 |
| f1 | 7 | k | 8 | 4 | 5 |
The arithmetic mean of the following data is 25, find the value of k.
| x1 | 5 | 15 | 25 | 35 | 45 |
| f1 | 3 | k | 3 | 6 | 2 |
If the mean of the following data is 18.75. Find the value of p.
| x | 10 | 15 | P | 25 | 30 |
| f | 5 | 10 | 7 | 8 | 2 |
Find the value of p, if the mean of the following distribution is 20.
| x | 15 | 17 | 19 | 20+P | 23 |
| f | 2 | 3 | 4 | 5P | 6 |
Find the missing frequencies in the following frequency distribution if it is known that the mean of the distribution is 50.
| x | 10 | 30 | 50 | 70 | 90 | |
| f | 17 | f1 | 32 | f2 | 19 | Total 120 |
RD Sharma solutions for Mathematics [English] Class 10 15 Statistics Exercise 15.2 [Pages 13 - 14]
The number of telephone calls received at an exchange per interval for 250 successive one minute intervals are given in the following frequency table:
| No. of calls(x) | 0 | 1 | 2 | 3 | 4 | 5 | 6 |
| No. of intervals (f) | 15 | 24 | 29 | 46 | 54 | 43 | 39 |
Compute the mean number of calls per interval.
Five coins were simultaneously tossed 1000 times and at each toss the number of heads were observed. The number of tosses during which 0, 1, 2, 3, 4 and 5 heads were obtained are shown in the table below. Find the mean number of heads per toss.
| No. of heads per toss | No. of tosses |
| 0 | 38 |
| 1 | 144 |
| 2 | 342 |
| 3 | 287 |
| 4 | 164 |
| 5 | 25 |
| Total | 1000 |
The following table gives the number of branches and number of plants in the garden of a school.
| No. of branches (x) | 2 | 3 | 4 | 5 | 6 |
| No. of plants (f) | 49 | 43 | 57 | 38 | 13 |
Calculate the average number of branches per plant.
The following table gives the number of children of 150 families in a village. Find the average number of children per family.
| No. of children (x) | 0 | 1 | 2 | 3 | 4 | 5 |
| No. of families (f) | 10 | 21 | 55 | 42 | 15 | 7 |
The marks obtained out of 50, by 102 students in a Physics test are given in the frequency table below:
| Marks(x) | 15 | 20 | 22 | 24 | 25 | 30 | 33 | 38 | 45 |
| Frequency (f) | 5 | 8 | 11 | 20 | 23 | 18 | 13 | 3 | 1 |
Find the average number of marks.
The number of students absent in a class were recorded every day for 120 days and the information is given in the following frequency table:
| No. of students absent (x) | 0 | 1 | 2 | 3 | 4 | 5 | 6 | 7 |
| No. of days (f) | 1 | 4 | 10 | 50 | 34 | 15 | 4 | 2 |
Find the mean number of students absent per day.
In the first proof reading of a book containing 300 pages the following distribution of misprints was obtained:
| No. of misprints per page (x) | 0 | 1 | 2 | 3 | 4 | 5 |
| No. of pages (f) | 154 | 95 | 36 | 9 | 5 | 1 |
Find the average number of misprints per page.
The following distribution gives the number of accidents met by 160 workers in a factory during a month.
| No. of accidents(x) | 0 | 1 | 2 | 3 | 4 |
| No. of workers (f) | 70 | 52 | 34 | 3 | 1 |
Find the average number of accidents per worker.
Find the mean from the following frequency distribution of marks at a test in statistics:
| Marks(x) | 5 | 10 | 15 | 20 | 25 | 30 | 35 | 40 | 45 | 50 |
| No. of students (f) | 15 | 50 | 80 | 76 | 72 | 45 | 39 | 9 | 8 | 6 |
RD Sharma solutions for Mathematics [English] Class 10 15 Statistics Exercise 15.3 [Pages 22 - 25]
The following table gives the distribution of total household expenditure (in rupees) of manual workers in a city. Find the average expenditure (in rupees) per household.
| Expenditure (in rupees) (x1) |
Frequency(f1) |
| 100 - 150 | 24 |
| 150 - 200 | 40 |
| 200 - 250 | 33 |
| 250 - 300 | 28 |
| 300 - 350 | 30 |
| 350 - 400 | 22 |
| 400 - 450 | 16 |
| 450 - 500 | 7 |
A survey was conducted by a group of students as a part of their environment awareness programme, in which they collected the following data regarding the number of plants in 20 houses in a locality. Find the mean number of plants per house.
| Number of plants | 0 - 2 | 2 - 4 | 4 - 6 | 6 - 8 | 8 - 10 | 10 - 12 | 12 - 14 |
| Number of houses | 1 | 2 | 1 | 5 | 6 | 2 | 3 |
Which method did you use for finding the mean, and why?
Consider the following distribution of daily wages of 50 worker of a factory.
|
Daily wages (in Rs) |
100 − 120 |
120 − 140 |
140 −1 60 |
160 − 180 |
180 − 200 |
|
Number of workers |
12 |
14 |
8 |
6 |
10 |
Find the mean daily wages of the workers of the factory by using an appropriate method.
Thirty women were examined in a hospital by a doctor and the number of heartbeats per minute were recorded and summarized as follows. Fine the mean heartbeats per minute for these women, choosing a suitable method.
| Number of heartbeats per minute | 65 - 68 | 68 - 71 | 71 - 74 | 74 - 77 | 77 - 80 | 80 - 83 | 83 - 86 |
| Number of women | 2 | 4 | 3 | 8 | 7 | 4 | 2 |
Find the mean of each of the following frequency distributions: (5 - 14)
| Class interval | 0 - 6 | 6 - 12 | 12 - 18 | 18 - 24 | 24 - 30 |
| Frequency | 6 | 8 | 10 | 9 | 7 |
Find the mean of each of the following frequency distributions
| Class interval | 50 - 70 | 70 - 90 | 90 - 110 | 110 - 130 | 130 - 150 | 150 - 170 |
| Frequency | 18 | 12 | 13 | 27 | 8 | 22 |
Find the mean of each of the following frequency distributions
| Class interval | 0 - 8 | 8 - 16 | 16 - 24 | 24 - 32 | 32 - 40 |
| Frequency | 6 | 7 | 10 | 8 | 9 |
Find the mean of each of the following frequency distributions
| Class interval | 0 - 6 | 6 - 12 | 12 - 18 | 18 - 24 | 24 - 30 |
| Frequency | 7 | 5 | 10 | 12 | 6 |
Find the mean of each of the following frequency distributions
| Class interval | 0 - 10 | 10 - 20 | 20 - 30 | 30 - 40 | 40 - 50 |
| Frequency | 9 | 12 | 15 | 10 | 14 |
Find the mean of each of the following frequency distributions
| Class interval | 0 - 8 | 8 - 16 | 16 - 24 | 24 - 32 | 32 - 40 |
| Frequency | 5 | 9 | 10 | 8 | 8 |
Find the mean of each of the following frequency distributions
| Class interval | 0 - 8 | 8 - 16 | 16 - 24 | 24 - 32 | 32 - 40 |
| Frequency | 5 | 6 | 4 | 3 | 2 |
Find the mean of each of the following frequency distributions
| Class interval | 10 - 30 | 30 - 50 | 50 - 70 | 70 - 90 | 90 - 110 | 110 - 130 |
| Frequency | 5 | 8 | 12 | 20 | 3 | 2 |
Find the mean of each of the following frequency distributions
| Class interval | 25 - 35 | 35 - 45 | 45 - 55 | 55 - 65 | 65 - 75 |
| Frequency | 6 | 10 | 8 | 12 | 4 |
Find the mean of each of the following frequency distributions
| Classes | 25 - 29 | 30 - 34 | 35 - 39 | 40 - 44 | 45 - 49 | 50 - 54 | 55 - 59 |
| Frequency | 14 | 22 | 16 | 6 | 5 | 3 | 4 |
For the following distribution, calculate mean using all suitable methods:
| Size of item | 1 - 4 | 4 - 9 | 9 - 16 | 16 - 27 |
| Frequency | 6 | 12 | 26 | 20 |
The weekly observations on cost of living index in a certain city for the year 2004 - 2005 are given below. Compute the weekly cost of living index.
| Cost of living Index | Number of Students |
| 1400 - 1500 | 5 |
| 1500 - 1600 | 10 |
| 1600 - 1700 | 20 |
| 1700 - 1800 | 9 |
| 1800 - 1900 | 6 |
| 1900 - 2000 | 2 |
The following table shows the marks scored by 140 students in an examination of a certain paper:
| Marks: | 0 - 10 | 10 - 20 | 20 - 30 | 30 - 40 | 40 - 50 |
| Number of students: | 20 | 24 | 40 | 36 | 20 |
Calculate the average marks by using all the three methods: direct method, assumed mean deviation and shortcut method.
The mean of the following frequency distribution is 62.8 and the sum of all the frequencies is 50. Compute the missing frequency f1 and f2.
| Class | 0 - 20 | 20 - 40 | 40 - 60 | 60 - 80 | 80 - 100 | 100 - 120 |
| Frequency | 5 | f1 | 10 | f2 | 7 | 8 |
The following distribution shows the daily pocket allowance given to the children of a multistorey building. The average pocket allowance is Rs 18.00. Find out the missing frequency.
| Class interval | 11 - 13 | 13 - 15 | 15 - 17 | 17 - 19 | 19 - 21 | 21 - 23 | 23 - 25 |
| Frequency | 7 | 6 | 9 | 13 | - | 5 | 4 |
If the mean of the following distribution is 27, find the value of p.
| Class | 0 - 10 | 10 - 20 | 20 - 30 | 30 - 40 | 40 - 50 |
| Frequency | 8 | p | 12 | 13 | 10 |
In a retail market, fruit vendors were selling mangoes kept in packing boxes. These boxes contained varying number of mangoes. The following was the distribution of mangoes according to the number of boxes.
| Number of mangoe | 50 − 52 | 53 − 55 | 56 − 58 | 59 − 61 | 62 − 64 |
| Number of boxes | 15 | 110 | 135 | 115 | 25 |
Find the mean number of mangoes kept in a packing box. Which method of finding the mean did you choose?
The table below shows the daily expenditure on food of 25 households in a locality.
| Daily expenditure (in Rs) | 100 − 150 | 150 − 200 | 200 − 250 | 250 − 300 | 300 − 350 |
| Number of households | 4 | 5 | 12 | 2 | 2 |
Find the mean daily expenditure on food by a suitable method.
To find out the concentration of SO2 in the air (in parts per million, i.e., ppm), the data was collected for 30 localities in a certain city and is presented below:
| concentration of SO2 (in ppm) | Frequency |
| 0.00 − 0.04 | 4 |
| 0.04 − 0.08 | 9 |
| 0.08 − 0.12 | 9 |
| 0.12 − 0.16 | 2 |
| 0.16 − 0.20 | 4 |
| 0.20 − 0.24 | 2 |
Find the mean concentration of SO2 in the air.
A class teacher has the following absentee record of 40 students of a class for the whole term. Find the mean number of days a student was absent.
| Number of days | 0 - 6 | 6 - 10 | 10 -14 | 14 -20 | 20 -28 | 28 -38 | 38 -40 |
| Number of students | 11 | 10 | 7 | 4 | 4 | 3 | 1 |
The following table gives the literacy rate (in percentage) of 35 cities. Find the mean literacy rate.
| Literacy rate (in %) | 45 − 55 | 55 − 65 | 65 − 75 | 75 − 85 | 85 − 95 |
| Number of cities | 3 | 10 | 11 | 8 | 3 |
The following is the cumulative frequency distribution ( of less than type ) of 1000 persons each of age 20 years and above . Determine the mean age .
| Age below (in years): | 30 | 40 | 50 | 60 | 70 | 80 |
| Number of persons : | 100 | 220 | 350 | 750 | 950 | 1000 |
If the mean of the following frequency distribution is 18, find the missing frequency.
| Class interval | 11 – 13 | 13 – 15 | 15 – 17 | 17 – 19 | 19 – 21 | 21 – 23 | 23 – 25 |
| Frequency | 3 | 6 | 9 | 13 | f | 5 | 4 |
Find the missing frequencies in the following frequency distribution if it is known that the mean of the distribution is 50.
| x | 10 | 30 | 50 | 70 | 90 | |
| f | 17 | f1 | 32 | f2 | 19 | Total 120 |
The daily income of a sample of 50 employees are tabulated as follows:
| Income (in Rs.): | 1-1200 | 201 -400 | 401-600 | 601 - 800 |
| No.of employees : | 14 | 15 | 14 | 7 |
Find the mean daily income of employees.
RD Sharma solutions for Mathematics [English] Class 10 15 Statistics Exercise 15.4 [Pages 34 - 36]
Following are the lives in hours of 15 pieces of the components of aircraft engine. Find the median:
715, 724, 725, 710, 729, 745, 694, 699, 696, 712, 734, 728, 716, 705, 719.
The following is the distribution of height of students of a certain class in a certain city:
| Height (in cm): | 160 - 162 | 163 - 165 | 166 - 168 | 169 - 171 | 172 - 174 |
| No. of students: | 15 | 118 | 142 | 127 | 18 |
Find the median height.
Following is the distribution of I.Q. of loo students. Find the median I.Q.
| I.Q.: | 55 - 64 | 65 - 74 | 75 - 84 | 85 - 94 | 95 - 104 | 105 - 114 | 115 - 124 | 125 - 134 | 135 - 144 |
| No of Students: | 1 | 2 | 9 | 22 | 33 | 22 | 8 | 2 | 1 |
Calculate the median from the following data:
| Rent (in Rs.): | 15 - 25 | 25 - 35 | 35 - 45 | 45 - 55 | 55 - 65 | 65 - 75 | 75 - 85 | 85 - 95 |
| No. of Houses: | 8 | 10 | 15 | 25 | 40 | 20 | 15 | 7 |
Calculate the median from the following data:
| Marks below: | 10 | 20 | 30 | 40 | 50 | 60 | 70 | 80 |
| No. of students: | 15 | 35 | 60 | 84 | 96 | 127 | 198 | 250 |
Calculate the missing frequency from the following distribution, it being given that the median of the distribution is 24.
| Age in years | 0 - 10 | 10 - 20 | 20 - 30 | 30 - 40 | 40 - 50 |
| No. of persons | 5 | 25 | ? | 18 | 7 |
The following table gives the frequency distribution of married women by age at marriage:
| Age (in years) | Frequency |
| 15-19 | 53 |
| 20-24 | 140 |
| 25-29 | 98 |
| 30-34 | 32 |
| 35-39 | 12 |
| 40-44 | 9 |
| 45-49 | 5 |
| 50-54 | 3 |
| 55-59 | 3 |
| 60 and above | 2 |
Calculate the median and interpret the results.
Find the following table gives the distribution of the life time of 400 neon lamps:
| Life time (in hours) | Number of lamps |
| 1500 – 2000 | 14 |
| 2000 – 2500 | 56 |
| 2500 – 3000 | 60 |
| 3000 – 3500 | 86 |
| 3500 – 4000 | 74 |
| 4000 – 4500 | 62 |
| 4500 – 5000 | 48 |
Find the median life time of a lamp.
The distribution below gives the weights of 30 students of a class. Find the median weight of the students.
| Weight (in kg) | 40−45 | 45−50 | 50−55 | 55−60 | 60−65 | 65−70 | 70−75 |
| Number of students | 2 | 3 | 8 | 6 | 6 | 3 | 2 |
Find the missing frequencies and the median for the following distribution if the mean is 1.46.
| No. of accidents: | 0 | 1 | 2 | 3 | 4 | 5 | Total |
| Frequency (No. of days): | 46 | ? | ? | 25 | 10 | 5 | 200 |
An incomplete distribution is given below:
| Variable: | 10-20 | 20-30 | 30-40 | 40-50 | 50-60 | 60-70 | 70-80 |
| Frequency: | 12 | 30 | - | 65 | - | 25 | 18 |
You are given that the median value is 46 and the total number of items is 230.
(i) Using the median formula fill up missing frequencies.
(ii) Calculate the AM of the completed distribution.
If the median of the distribution given below is 28.5, find the values of x and y.
| Class interval | Frequency |
| 0 - 10 | 5 |
| 10 - 20 | x |
| 20 - 30 | 20 |
| 30 - 40 | 15 |
| 40 - 50 | y |
| 50 - 60 | 5 |
| Total | 60 |
The median of the following data is 525. Find the missing frequency, if it is given that there are 100 observations in the data:
| Class interval | Frequency |
| 0 - 100 | 2 |
| 100 - 200 | 5 |
| 200 - 300 | f1 |
| 300 - 400 | 12 |
| 400 - 500 | 17 |
| 500 - 600 | 20 |
| 600 - 700 | f2 |
| 700 - 800 | 9 |
| 800 - 900 | 7 |
| 900 - 1000 | 4 |
If the median of the following data is 32.5, find the missing frequencies.
| Class interval: | 0 - 10 | 10 - 20 | 20 - 30 | 30 - 40 | 40 - 50 | 50 - 60 | 60 - 70 | Total |
| Frequency: | f1 | 5 | 9 | 12 | f2 | 3 | 2 | 40 |
Compute the median for the following data:
| Marks | No. of students |
| Less than 10 | 0 |
| Less than 30 | 10 |
| Less than 50 | 25 |
| Less than 70 | 43 |
| Less than 90 | 65 |
| Less than 110 | 87 |
| Less than 130 | 96 |
| Less than 150 | 100 |
Compute the median for the following data:
| Marks | No. of students |
| More than 150 | 0 |
| More than 140 | 12 |
| More than 130 | 27 |
| More than 120 | 60 |
| More than 110 | 105 |
| More than 100 | 124 |
| More than 90 | 141 |
| More than 80 | 150 |
A survey regarding the height (in cm) of 51 girls of class X of a school was conducted and the following data was obtained:
| Height in cm | Number of Girls |
| Less than 140 | 4 |
| Less than 145 | 11 |
| Less than 150 | 29 |
| Less than 155 | 40 |
| Less than 160 | 46 |
| Less than 165 | 51 |
Find the median height.
A life insurance agent found the following data for distribution of ages of 100 policy holders. Calculate the median age, if policies are given only to persons having age 18 years onwards but less than 60 years.
| Age (in years) | Number of policy holders |
| Below 20 | 2 |
| 20 - 25 | 4 |
| 25 - 30 | 18 |
| 30 - 35 | 21 |
| 35 - 40 | 33 |
| 40 - 45 | 11 |
| 45 - 50 | 3 |
| 50 - 55 | 6 |
| 55 - 60 | 2 |
The lengths of 40 leaves of a plant are measured correct to the nearest millimeter, and the data obtained is represented in the following table:
| Length (in mm) | Number of leaves |
| 118 − 126 | 3 |
| 127 – 135 | 5 |
| 136 − 144 | 9 |
| 145 – 153 | 12 |
| 154 – 162 | 5 |
| 163 – 171 | 4 |
| 172 – 180 | 2 |
Find the median length of the leaves.
(Hint: The data needs to be converted to continuous classes for finding the median, since the formula assumes continuous classes. The classes then change to 117.5 − 126.5, 126.5 − 135.5… 171.5 − 180.5)
An incomplete distribution is given as follows:
| Variable: | 0 - 10 | 10 - 20 | 20 - 30 | 30 - 40 | 40 - 50 | 50 - 60 | 60 - 70 |
| Frequency: | 10 | 20 | ? | 40 | ? | 25 | 15 |
You are given that the median value is 35 and the sum of all the frequencies is 170. Using the median formula, fill up the missing frequencies.
The median of the distribution given below is 14.4 . Find the values of x and y , if the total frequency is 20.
| Class interval : | 0-6 | 6-12 | 12-18 | 18-24 | 24-30 |
| Frequency : | 4 | x | 5 | y | 1 |
The median of the following data is 50. Find the values of p and q, if the sum of all the frequencies is 90.
| Marks: | 20 -30 | 30-40 | 40-50 | 50-60 | 60-70 | 70-80 | 80-90 |
| Frequency: | P | 15 | 25 | 20 | q | 8 | 10 |
RD Sharma solutions for Mathematics [English] Class 10 15 Statistics Exercise 15.5 [Pages 45 - 48]
Find the mode of the following data:
3, 5, 7, 4, 5, 3, 5, 6, 8, 9, 5, 3, 5, 3, 6, 9, 7, 4
Find the mode of the following data:
3, 3, 7, 4, 5, 3, 5, 6, 8, 9, 5, 3, 5, 3, 6, 9, 7, 4
Find the mode of the following data:
15, 8, 26, 25, 24, 15, 18, 20, 24, 15, 19, 15
The shirt sizes worn by a group of 200 persons, who bought the shirt from a store, are as follows:
| Shirt size: | 37 | 38 | 39 | 40 | 41 | 42 | 43 | 44 |
| Number of persons: | 15 | 25 | 39 | 41 | 36 | 17 | 15 | 12 |
Find the model shirt size worn by the group.
Find the mode of the following distribution.
| Class-interval: | 0 - 10 | 10 - 20 | 20 - 30 | 30 - 40 | 40 - 50 | 50 - 60 | 60 - 70 | 70 - 80 |
| Frequency: | 5 | 8 | 7 | 12 | 28 | 20 | 10 | 10 |
Find the mode of the following distribution.
| Class-interval: | 10 - 15 | 15 - 20 | 20 - 25 | 25 - 30 | 30 - 35 | 35 - 40 |
| Frequency: | 30 | 45 | 75 | 35 | 25 | 15 |
Find the mode of the following distribution.
| Class-interval: | 25 - 30 | 30 - 35 | 35 - 40 | 40 - 45 | 45 - 50 | 50 - 55 |
| Frequency: | 25 | 34 | 50 | 42 | 38 | 14 |
Compare the modal ages of two groups of students appearing for an entrance test:
| Age (in years): | 16-18 | 18-20 | 20-22 | 22-24 | 24-26 |
| Group A: | 50 | 78 | 46 | 28 | 23 |
| Group B: | 54 | 89 | 40 | 25 | 17 |
The marks in science of 80 students of class X are given below: Find the mode of the marks obtained by the students in science.
| Marks: | 0 - 10 | 10 - 20 | 20 - 30 | 30 - 40 | 40 - 50 | 50 - 60 | 60 - 70 | 70 - 80 | 80 - 90 | 90 - 100 |
| Frequency: | 3 | 5 | 16 | 12 | 13 | 20 | 5 | 4 | 1 | 1 |
The following is the distribution of height of students of a certain class in a certain city:
| Height (in cm): | 160 - 162 | 163 - 165 | 166 - 168 | 169 - 171 | 172 - 174 |
| No. of students: | 15 | 118 | 142 | 127 | 18 |
Find the average height of maximum number of students.
The following table shows the ages of the patients admitted in a hospital during a year:
| Age (in years) | 5 − 15 | 15 − 25 | 25 − 35 | 35 − 45 | 45 − 55 | 55 − 65 |
| Number of patients | 6 | 11 | 21 | 23 | 14 | 5 |
Find the mode and the mean of the data given above. Compare and interpret the two measures of central tendency.
The following data gives the information on the observed lifetimes (in hours) of 225 electrical components:
| Lifetimes (in hours) | 0 − 20 | 20 − 40 | 40 − 60 | 60 − 80 | 80 − 100 | 100− 120 |
| Frequency | 10 | 35 | 52 | 61 | 38 | 29 |
Determine the modal lifetimes of the components.
The following table gives the daily income of 50 workers of a factory:
| Daily income (in Rs) | 100 - 120 | 120 - 140 | 140 - 160 | 160 - 180 | 180 - 200 |
| Number of workers: | 12 | 14 | 8 | 6 | 10 |
Find the mean, mode and median of the above data.
The following distribution gives the state-wise teacher-student ratio in higher secondary schools of India. Find the mode and mean of this data. Interpret the two measures.
| Number of students per teacher |
Number of states/U.T. |
| 15 − 20 | 3 |
| 20 − 25 | 8 |
| 25 − 30 | 9 |
| 30 − 35 | 10 |
| 35 − 40 | 3 |
| 40 − 45 | 0 |
| 45 − 50 | 0 |
| 50 − 55 | 2 |
Find the mean, median and mode of the following data:
| Classes: | 0 – 50 | 50 – 100 | 100 – 150 | 150 – 200 | 200 – 250 | 250 – 300 | 300 – 350 |
| Frequency: | 2 | 3 | 5 | 6 | 5 | 3 | 1 |
A student noted the number of cars passing through a spot on a road for 100 periods each of 3 minutes and summarised it in the table given below. Find the mode of the data.
| Number of cars | 0 − 10 | 10 − 20 | 20 − 30 | 30 − 40 | 40 − 50 | 50 − 60 | 60 − 70 | 70 − 80 |
| Frequency | 7 | 14 | 13 | 12 | 20 | 11 | 15 | 8 |
The following frequency distribution gives the monthly consumption of electricity of 68 consumers of a locality. Find the median, mean and mode of the data and compare them.
| Monthly consumption (in units) | Number of consumers |
| 65 - 85 | 4 |
| 85 - 105 | 5 |
| 105 - 125 | 13 |
| 125 - 145 | 20 |
| 145 - 165 | 14 |
| 165 - 185 | 8 |
| 185 - 205 | 4 |
100 surnames were randomly picked up from a local telephone directory and the frequency distribution of the number of letters in the English alphabets in the surnames was obtained as follows:
| Number of letters | Number of surnames |
| 1 - 4 | 6 |
| 4 − 7 | 30 |
| 7 - 10 | 40 |
| 10 - 13 | 6 |
| 13 - 16 | 4 |
| 16 − 19 | 4 |
Determine the median number of letters in the surnames. Find the mean number of letters in the surnames? Also, find the modal size of the surnames.
Find the mean, median and mode of the following data:
| Classes: | 0-20 | 20-40 | 40-60 | 40-60 | 80-100 | 100-120 | 120-140 |
| Frequency: | 6 | 8 | 10 | 12 | 6 | 5 | 3 |
The following data gives the distribution of total monthly household expenditure of 200 families of a village. Find the modal monthly expenditure of the families. Also, find the mean monthly expenditure.
| Expenditure (in Rs) | Number of families |
| 1000 − 1500 | 24 |
| 1500 − 2000 | 40 |
| 2000 − 2500 | 33 |
| 2500 − 3000 | 28 |
| 3000 − 3500 | 30 |
| 3500 − 4000 | 22 |
| 4000 − 4500 | 16 |
| 4500 − 5000 | 7 |
The given distribution shows the number of runs scored by some top batsmen of the world in one-day international cricket matches.
| Runs scored | Number of batsmen |
| 3000 − 4000 | 4 |
| 4000 − 5000 | 18 |
| 5000 − 6000 | 9 |
| 6000 − 7000 | 7 |
| 7000 − 8000 | 6 |
| 8000 − 9000 | 3 |
| 9000 − 10000 | 1 |
| 10000 − 11000 | 1 |
Find the mode of the data.
The frequency distribution for agriculture holdings in a village is given below:
| Area of land (in hectares) | 1 – 3 | 3 – 5 | 5 – 7 | 7 – 9 | 9 – 11 | 11 – 13 |
| Number of families | 20 | 45 | 80 | 55 | 40 | 12 |
Find the modal agriculture holding per family.
The monthly income of 100 families are given as below :
| Income in ( in ₹) | Number of families |
| 0-5000 | 8 |
| 5000-10000 | 26 |
| 10000-15000 | 41 |
| 15000-20000 | 16 |
| 20000-25000 | 3 |
| 25000-30000 | 3 |
| 30000-35000 | 2 |
| 35000-40000 | 1 |
Calculate the modal income.
RD Sharma solutions for Mathematics [English] Class 10 15 Statistics Exercise 15.6 [Pages 62 - 64]
Draw an ogive by less than method for the following data:
| No. of rooms: | 1 | 2 | 3 | 4 | 5 | 6 | 7 | 8 | 9 | 10 |
| No. of houses: | 4 | 9 | 22 | 28 | 24 | 12 | 8 | 6 | 5 | 2 |
The marks scored by 750 students in an examination are given in the form of a frequency distribution table:
| Marks | No. of students |
| 600 - 640 | 16 |
| 640 - 680 | 45 |
| 680 - 720 | 156 |
| 720 - 760 | 284 |
| 760 - 800 | 172 |
| 800 - 840 | 59 |
| 840 - 880 | 18 |
Draw an ogive to represent the following frequency distribution:
| Class-interval: | 0 - 4 | 5 - 9 | 10 - 14 | 15 - 19 | 20 - 24 |
| Frequency: | 2 | 6 | 10 | 5 | 3 |
The monthly profits (in Rs.) of 100 shops are distributed as follows:
| Profits per shop: | 0 - 50 | 50 - 100 | 100 - 150 | 150 - 200 | 200 - 250 | 250 - 300 |
| No. of shops: | 12 | 18 | 27 | 20 | 17 | 6 |
Draw the frequency polygon for it.
The following distribution gives the daily income of 50 workers of a factory.
| Daily income (in Rs | 100 − 120 | 120 − 140 | 140 − 160 | 160 − 180 | 180 − 200 |
| Number of workers | 12 | 14 | 8 | 6 | 10 |
Convert the distribution above to a less than type cumulative frequency distribution, and draw its ogive.
The following table gives production yield per hectare of wheat of 100 farms of a village:
| Production yield in kg per hectare: | 50 - 55 | 55 - 60 | 60 - 65 | 65 - 70 | 70 - 75 | 75 - 80 |
| Number of farms: | 2 | 8 | 12 | 24 | 38 | 16 |
Draw ‘less than’ ogive and ‘more than’ ogive.
During the medical check-up of 35 students of a class, their weights were recorded as follows:
| Weight (in kg | Number of students |
| Less than 38 | 0 |
| Less than 40 | 3 |
| Less than 42 | 5 |
| Less than 44 | 9 |
| Less than 46 | 14 |
| Less than 48 | 28 |
| Less than 50 | 32 |
| Less than 52 | 35 |
Draw a less than type ogive for the given data. Hence obtain the median weight from the graph verify the result by using the formula.
The annual rainfall record of a city for 66 days is given in the following table :
| Rainfall (in cm ): | 0-10 | 10-20 | 20-30 | 30-40 | 40-50 | 50-60 |
| Number of days : | 22 | 10 | 8 | 15 | 5 | 6 |
Calculate the median rainfall using ogives of more than type and less than type.
The following table gives the height of trees:
| Height | No. of trees |
| Less than 7 Less than 14 Less than 21 Less than 28 Less than 35 Less than 42 Less than 49 Less than 56 |
26 57 92 134 216 287 341 360 |
Draw 'less than' ogive and 'more than' ogive.
The annual profits earned by 30 shops of a shopping complex in a locality give rise to the following distribution:
| Profit (in lakhs in Rs) | Number of shops (frequency) |
| More than or equal to 5 More than or equal to 10 More than or equal to 15 More than or equal to 20 More than or equal to 25 More than or equal to 30 More than or equal to 35 |
30 28 16 14 10 7 3 |
Draw both ogives for the above data and hence obtain the median.
RD Sharma solutions for Mathematics [English] Class 10 15 Statistics Exercise 15.7 [Pages 65 - 66]
Define mean.
What is the algebraic sum of deviation of a frequency distribution about its mean?
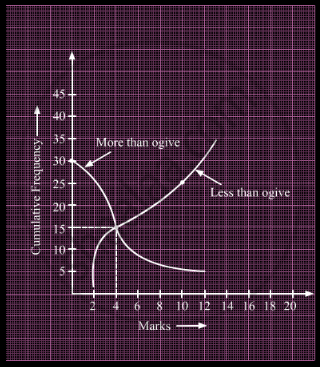
Which measure of central tendency is given by the x-coordinate of the point of intersection of the 'more than' ogive and 'less than' ogive?
What is the value of the median of the data using the graph in the following figure of less than ogive and more than ogive?
Write the empirical relation between mean, mode and median.
Which measure of central tendency can be determine graphically?
Write the modal class for the following frequency distribution:
| Class-interval: | 10−15 | 15−20 | 20−25 | 25−30 | 30−35 | 35−40 |
| Frequency: | 30 | 35 | 75 | 40 | 30 | 15 |
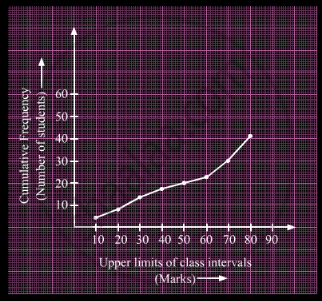
A student draws a cumulative frequency curve for the marks obtained by 40 students of a class as shown below. Find the median marks obtained by the students of the class.
Write the median class for the following frequency distribution:
| Class-interval: | 0−10 | 10−20 | 20−30 | 30−40 | 40−50 | 50−60 | 60−70 | 70−80 |
| Frequency: | 5 | 8 | 7 | 12 | 28 | 20 | 10 | 10 |
In the graphical representation of a frequency distribution, if the distance between mode and mean is ktimes the distance between median and mean, then write the value of k.
Find the class marks of classes 10−25 and 35−55.
Write the median class of the following distribution:
| Class-interval: | 0−10 | 10−20 | 20−30 | 30−40 | 40−50 | 50−60 | 60−70 |
| Frequency: | 4 | 4 | 8 | 10 | 12 | 8 | 4 |
RD Sharma solutions for Mathematics [English] Class 10 15 Statistics Exercise 15.8 [Pages 66 - 69]
Which of the following is not a measure of central tendency?
Mean
Median
Mode
Standard deviation
The algebraic sum of the deviations of a frequency distribution from its mean is always ______.
Always positive
Always negative
Zero
A non-zero number
The arithmetic mean of 1, 2, 3, ... , n is
\[\frac{n + 1}{2}\]
\[\frac{n - 1}{2}\]
\[\frac{n}{2}\]
\[\frac{n}{2} + 1\]
For a frequency distribution, mean, median and mode are connected by the relation
Mode = 3 Mean − 2 Median
Mode = 2 Median − 3 Mean
Mode = 3 Median − 2 Mean
Mode = 3 Median + 2 Mean
Which of the following cannot be determined graphically?
Mean
Median
Mode
None of these
The median of a given frequency distribution is found graphically with the help of
Histogram
Frequency curve
Frequency polygon
Ogive
The mode of a frequency distribution can be determined graphically from ______.
Histogram
Frequency polygon
Ogive
Frequency curve
Mode is
least frequency value
middle most value
most frequent value
None of these
The mean of n observation is `overlineX` . If the first item is increased by 1, second by 2 and so on, then the new mean is
`overlineX+n`
`overlineX+n/2`
`overlineX+(n+1)/2`
None of these
One of the methods of determining mode is ______.
Mode = 2 Median - 3 Mean
Mode = 2 Median + 3 Mean
Mode = 3 Median - 2 Mean
Mode = 3 Median + 2 Mean
If the mean of the following distribution is 2.6, then the value of y is:
| Variable (x) | 1 | 2 | 3 | 4 | 5 |
| Frequency | 4 | 5 | y | 1 | 2 |
3
8
13
24
The relationship between mean, median and mode for a moderately skewed distribution is.
Mode = 2 Median - 3 Mean
Mode = Median - 2 Mean
Mode = 2 Median - Mean
Mode = 3 Median - 2 Mean
The mean of a discrete frequency distribution xi / fi, i = 1, 2, ......, n is given by
`overlineX = (sum f_ix_i)/(sumf_i)`
\[\frac{1}{n} \sum^n_{i = 1} f_i x_i\]
\[\frac{\sum^n_{i = 1} f_i x_i}{\sum^n_{i = 1} x_i}\]
\[\frac{\sum^n_{i = 1} f_i x_i}{\sum^n_{1 = 1} i}\]
If the arithmetic mean of x, x + 3, x + 6, x + 9, and x + 12 is 10, the x =
1
2
6
4
If the median of the data: 24, 25, 26, x + 2, x + 3, 30, 31, 34 is 27.5, then x =
27
25
28
30
If the median of the data: 6, 7, x − 2, x, 17, 20, written in ascending order, is 16. Then x=
15
16
17
18
The median of first 10 prime numbers is
11
12
13
14
If the mode of the data: 64, 60, 48, x, 43, 48, 43, 34 is 43, then x + 3 =
44
45
46
48
If the mode of the data: 16, 15, 17, 16, 15, x, 19, 17, 14 is 15, then x =
15
16
17
19
The mean of 1, 3, 4, 5, 7, 4 is m. The numbers 3, 2, 2, 4, 3, 3, p have mean m − 1 and median q. Then, p + q =
4
5
6
7
If the mean of frequency distribution is 8.1 and Σfixi = 132 + 5k, Σfi = 20, then k =?
3
4
5
6
If the mean of 6, 7, x, 8, y, 14 is 9, then ______.
x + y = 21
x + y = 19
x − y = 19
x − y = 21
The mean of n observation is `overlineX`. If the first observation is increased by 1, the second by 2, the third by 3, and so on, then the new mean is
- `overlineX`\[ + \left( 2n + 1 \right)\]
- `overlineX`\[+ \frac{n + 1}{2}\]
- `overlineX`\[ + \left( n + 1 \right)\]
`overlineX`\[ - \frac{n + 1}{2}\]
If the mean of first n natural numbers is \[\frac{5n}{9}\], then n =
5
4
9
10
The arithmetic mean and mode of a data are 24 and 12 respectively, then its median is
25
18
20
22
The mean of first n odd natural number is
\[\frac{n + 1}{2}\]
\[\frac{n}{2}\]
n
`n^2`
The mean of first n odd natural numbers is \[\frac{n^2}{81}\],then n =
9
81
27
18
If the difference of Mode and Median of a data is 24, then the difference of median and mean is ______.
12
24
8
36
If the arithmetic mean, 7, 8, x, 11, 14 is x, then x =
9
9.5
10
10.5
If mode of a series exceeds its mean by 12, then mode exceeds the median by
4
8
6
10
If the mean of first n natural number is 15, then n =
15
30
14
29
If the mean of observation \[x_1 , x_2 , . . . . , x_n is x\] then the mean of x1 + a, x2 + a, ....., xn + a is
a`overlineX`
`overlineX -a`
`overlineX +a`
`overlineX/a`
Mean of a certain number of observation is `overlineX`. If each observation is divided by m(m ≠ 0) and increased by n, then the mean of new observation is
`overlineX/m +n`
`overlineX/n+m`
`overlineX +n/m`
`overlineX +m/n`
If \[u_i = \frac{x_i - 25}{10}, \Sigma f_i u_i = 20, \Sigma f_i = 100, \text { then }\]`overlineX`
23
24
27
25
If 35 is removed from the data: 30, 34, 35, 36, 37, 38, 39, 40, then the median increased by
2
1.5
1
0.5
While computing mean of grouped data, we assume that the frequencies are ______.
evenly distributed over all the classes
centred at the class marks of the classes
centred at the upper limit of the classes
centred at the lower limit of the classes
In the formula `barx=a+h((sumf_iu_i)/(sumf_i))`, for finding the mean of grouped frequency distribution ui = ______.
`(x_i+a)/h`
h(xi - a)
`(x_i-a)/h`
`(a-x_i)/h`
For the following distribution:
| Class | 0 – 5 | 5 – 10 | 10 – 15 | 15 – 20 | 20 – 25 |
| Frequency | 10 | 15 | 12 | 20 | 9 |
The sum of lower limits of the median class and modal class is:
15
25
30
35
For the following distribution:
| Marks | Number of students |
| Below 10 | 3 |
| Below 20 | 12 |
| Below 30 | 27 |
| Below 40 | 57 |
| Below 50 | 75 |
| Below 60 | 80 |
The modal class is ______.
10 − 20
20 − 30
30 − 40
50 − 60
Consider the following frequency distributions
| Class | 65 - 85 | 85 - 105 | 105 - 125 | 125 - 145 | 145 - 165 | 165 - 185 | 185-205 |
| Frequency | 4 | 5 | 13 | 20 | 14 | 7 | 4 |
The difference of the upper limit of the median class and the lower limit of the modal class is?
0
19
20
38
In the formula
lower limits of classes
upper limits ofclasses
mid-points of classes
frequency of the class marks
The abscissa of the point of intersection of less than type and of the more than types cumulative frequency curves of a grouped data gives its ______.
Mean
Median
Mode
All of the above
Consider the following frequency distribution :
| Class: | 0-5 | 6-11 | 12-17 | 18-23 | 24-29 |
| Frequency: | 13 | 10 | 15 | 8 | 11 |
The upper limit of the median class is
17
17.5
18
18.5
Solutions for 15: Statistics
RD Sharma solutions for Mathematics [English] Class 10 chapter 15 - Statistics
Shaalaa.com has the CBSE Mathematics Mathematics [English] Class 10 CBSE solutions in a manner that help students grasp basic concepts better and faster. The detailed, step-by-step solutions will help you understand the concepts better and clarify any confusion. RD Sharma solutions for Mathematics Mathematics [English] Class 10 CBSE 15 (Statistics) include all questions with answers and detailed explanations. This will clear students' doubts about questions and improve their application skills while preparing for board exams.
Further, we at Shaalaa.com provide such solutions so students can prepare for written exams. RD Sharma textbook solutions can be a core help for self-study and provide excellent self-help guidance for students.
Concepts covered in Mathematics [English] Class 10 chapter 15 Statistics are Ogives (Cumulative Frequency Graphs), Applications of Ogives in Determination of Median, Relation Between Measures of Central Tendency, Introduction to Normal Distribution, Properties of Normal Distribution, Concept of Pie Graph (Or a Circle-graph), Tabulation of Data, Inclusive and Exclusive Type of Tables, Mean of Grouped Data, Median of Grouped Data, Graphical Representation of Data as Histograms, Frequency Polygon, Mode of Grouped Data, Concepts of Statistics, Method of Finding Mean for Grouped Data: Direct Method, Method of Finding Mean for Grouped Data: Deviation Or Assumed Mean Method, Method of Finding Mean for Grouped Data: the Step Deviation Method, Concept of Pictograph, Presentation of Data, Interpretation of Pie Diagram, Drawing a Pie Graph, Mean of Grouped Data, Mode of Grouped Data, Median of Grouped Data, Graphical Representation of Cumulative Frequency Distribution, Ogives (Cumulative Frequency Graphs), Concepts of Statistics, Concepts of Statistics.
Using RD Sharma Mathematics [English] Class 10 solutions Statistics exercise by students is an easy way to prepare for the exams, as they involve solutions arranged chapter-wise and also page-wise. The questions involved in RD Sharma Solutions are essential questions that can be asked in the final exam. Maximum CBSE Mathematics [English] Class 10 students prefer RD Sharma Textbook Solutions to score more in exams.
Get the free view of Chapter 15, Statistics Mathematics [English] Class 10 additional questions for Mathematics Mathematics [English] Class 10 CBSE, and you can use Shaalaa.com to keep it handy for your exam preparation.
