Advertisements
Advertisements
Question
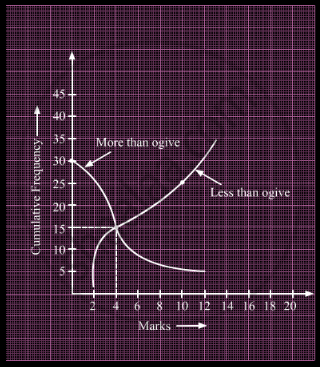
The abscissa of the point of intersection of less than type and of the more than types cumulative frequency curves of a grouped data gives its ______.
Options
Mean
Median
Mode
All of the above
Solution
The abscissa of the point of intersection of less than type and of the more than types cumulative frequency curves of a grouped data gives its median.
Explanation:-
The less than ogive and more than ogive when drawn on the same graph intersect at a point. From this point, if we draw a perpendicular on the x-axis, the point at which it cuts the x-axis gives us the median.
Thus, the abscissa of the point of intersection of less than type and of the more than type cumulative curves of a grouped data gives its median.
APPEARS IN
RELATED QUESTIONS
A life insurance agent found the following data for distribution of ages of 100 policy holders. Calculate the median age, if policies are given only to persons having age 18 years onwards but less than 60 years.
| Age (in years) | Number of policy holders |
| Below 20 | 2 |
| 20 - 25 | 4 |
| 25 - 30 | 18 |
| 30 - 35 | 21 |
| 35 - 40 | 33 |
| 40 - 45 | 11 |
| 45 - 50 | 3 |
| 50 - 55 | 6 |
| 55 - 60 | 2 |
An incomplete distribution is given as follows:
| Variable: | 0 - 10 | 10 - 20 | 20 - 30 | 30 - 40 | 40 - 50 | 50 - 60 | 60 - 70 |
| Frequency: | 10 | 20 | ? | 40 | ? | 25 | 15 |
You are given that the median value is 35 and the sum of all the frequencies is 170. Using the median formula, fill up the missing frequencies.
A student got the following marks in 9 questions of a question paper.
3, 5, 7, 3, 8, 0, 1, 4 and 6.
Find the median of these marks.
What is the value of the median of the data using the graph in the following figure of less than ogive and more than ogive?

If the mean of the following distribution is 3, find the value of p.
| x | 1 | 2 | 3 | 5 | p + 4 |
| f | 9 | 6 | 9 | 3 | 6 |
The following are the marks scored by the students in the Summative Assessment exam
| Class | 0 − 10 | 10 − 20 | 20 − 30 | 30 − 40 | 40 − 50 | 50 − 60 |
| No. of Students | 2 | 7 | 15 | 10 | 11 | 5 |
Calculate the median.
Will the median class and modal class of grouped data always be different? Justify your answer.
The median of the following data is 525. Find the values of x and y, if the total frequency is 100.
| Class interval | Frequency |
| 0 – 100 | 2 |
| 100 – 200 | 5 |
| 200 – 300 | x |
| 300 – 400 | 12 |
| 400 – 500 | 17 |
| 500 – 600 | 20 |
| 600 – 700 | y |
| 700 – 800 | 9 |
| 800 – 900 | 7 |
| 900 – 1000 | 4 |
The monthly expenditure on milk in 200 families of a Housing Society is given below:
| Monthly Expenditure (in ₹) |
1000 – 1500 | 1500 – 2000 | 2000 – 2500 | 2500 – 3000 | 3000 – 3500 | 3500 – 4000 | 4000 – 4500 | 4500 – 5000 |
| Number of families | 24 | 40 | 33 | x | 30 | 22 | 16 | 7 |
Find the value of x and also, find the median and mean expenditure on milk.
Consider the following frequency distribution:
| Class | 0 – 6 | 6 – 12 | 12 – 18 | 18 – 24 | 24 – 30 |
| Frequency | 12 | 10 | 15 | 8 | 11 |
The median class is:
