Advertisements
Advertisements
Question
Following are the lives in hours of 15 pieces of the components of aircraft engine. Find the median:
715, 724, 725, 710, 729, 745, 694, 699, 696, 712, 734, 728, 716, 705, 719.
Solution
Lives in hours of is pieces are
= 715, 724, 725, 710, 729, 745, 694, 699, 696, 712, 734, 728, 719, 705, 705, 719.
Arrange the above data in a sending order
694, 696, 699, 705, 710, 712, 715, 716, 719, 721, 725, 728, 729, 734, 745
N = 15(odd)
Median `=((N+1)/2)^(th)` term
`=((15+1)/2)^(th)`term
= 8th term
= 716
APPEARS IN
RELATED QUESTIONS
The distribution below gives the weights of 30 students of a class. Find the median weight of the students.
| Weight (in kg) | 40−45 | 45−50 | 50−55 | 55−60 | 60−65 | 65−70 | 70−75 |
| Number of students | 2 | 3 | 8 | 6 | 6 | 3 | 2 |
The marks obtained by 19 students of a class are given below:
27, 36, 22, 31, 25, 26, 33, 24, 37, 32, 29, 28, 36, 35, 27, 26, 32, 35 and 28.
Find:
- Median
- Lower quartile
- Upper quartile
- Inter-quartile range
Calculate the missing frequency from the following distribution, it being given that the median of distribution is 24.
| Class | 0 – 10 | 10 – 20 | 20 – 30 | 30 – 40 | 40 - 50 |
| Frequency | 5 | 25 | ? | 18 | 7 |
The following table shows the information regarding the milk collected from farmers on a milk collection centre and the content of fat in the milk, measured by a lactometer. Find the mode of fat content.
| Content of fat (%) | 2 - 3 | 3 - 4 | 4 - 5 | 5 - 6 | 6 - 7 |
| Milk collected (Litre) | 30 | 70 | 80 | 60 | 20 |
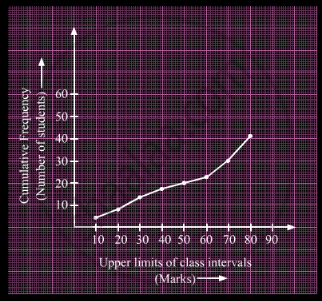
A student draws a cumulative frequency curve for the marks obtained by 40 students of a class as shown below. Find the median marks obtained by the students of the class.

Find a certain frequency distribution, the value of mean and mode are 54.6 and 54 respectively. Find the value of median.
Find the median of the scores 7, 10, 5, 8, 9.
The median of set of 9 distinct observations is 20.5. If each of the largest 4 observations of the set is increased by 2, then the median of the new set ______.
Pocket expenses of a class in a college are shown in the following frequency distribution:
| Pocket expenses |
0 - 200 |
200 - 400 |
400 - 600 |
600 - 800 |
800 - 1000 |
1000 - 1200 |
1200 - 1400 |
| Number of students | 33 | 74 | 170 | 88 | 76 | 44 | 25 |
Then the median for the above data is?
The median of first 10 natural numbers is ______.
