Advertisements
Advertisements
Question
The table below shows the salaries of 280 persons :
| Salary (In thousand Rs) | No. of Persons |
| 5 – 10 | 49 |
| 10 – 15 | 133 |
| 15 – 20 | 63 |
| 20 – 25 | 15 |
| 25 – 30 | 6 |
| 30 – 35 | 7 |
| 35 – 40 | 4 |
| 40 – 45 | 2 |
| 45 – 50 | 1 |
Calculate the median salary of the data.
Solution
| Salary (In thousand Rs) | Frequency | CF |
| 5 – 10 | 49 | 49 |
| 10 – 15 | 133 | 182 |
| 15 – 20 | 63 | 245 |
| 20 – 25 | 15 | 260 |
| 25 – 30 | 6 | 266 |
| 30 – 35 | 7 | 273 |
| 35 – 40 | 4 | 277 |
| 40 – 45 | 2 | 279 |
| 45 – 50 | 1 | 280 |
`N/2 = 280/2 = 140`
The cumulative frequency which is greater than and nearest to 140 is 182.
Median class = 10-15
We also have,
l (lower limit of median class) = 10
h (class size) = 5
n (number of observations) = 280
cf = (cumulative frequency of the class preceding the median class) = 49
f (frequency of median class) = 133
Median for grouped data is given by the formula :
Median = `l + ((n/2 - cf)/f) xx h`
where f is the frequency of median class and cf is the cumulative frequency of previous class.
Median = `10 + (140 - 49)/133 xx 5 = 13.42`
APPEARS IN
RELATED QUESTIONS
If the median of the distribution given below is 28.5, find the values of x and y.
| Class interval | Frequency |
| 0 - 10 | 5 |
| 10 - 20 | x |
| 20 - 30 | 20 |
| 30 - 40 | 15 |
| 40 - 50 | y |
| 50 - 60 | 5 |
| Total | 60 |
The marks obtained by 19 students of a class are given below:
27, 36, 22, 31, 25, 26, 33, 24, 37, 32, 29, 28, 36, 35, 27, 26, 32, 35 and 28.
Find:
- Median
- Lower quartile
- Upper quartile
- Inter-quartile range
Find the median wages for the following frequency distribution:
| Wages per day (in Rs) | 61 – 70 | 71 – 80 | 81 – 90 | 91 – 100 | 101 – 110 | 111 – 120 |
| No. of women workers | 5 | 15 | 20 | 30 | 20 | 8 |
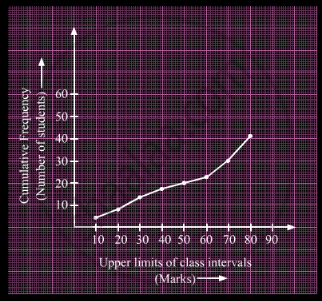
A student draws a cumulative frequency curve for the marks obtained by 40 students of a class as shown below. Find the median marks obtained by the students of the class.

Find the median of:
66, 98, 54, 92, 87, 63, 72.
Below is the given frequency distribution of words in an essay:
| Number of words | Number of Candidates |
| 600 - 800 | 12 |
| 800 - 1000 | 14 |
| 1000 - 1200 | 40 |
| 1200 - 1400 | 15 |
| 1400 - 1600 | 19 |
Find the mean number of words written.
Calculate the median of the following distribution:
| Weight (in nearest kg.) | No. of students |
| 46 | 7 |
| 48 | 5 |
| 50 | 8 |
| 52 | 12 |
| 53 | 10 |
| 54 | 2 |
| 55 | 1 |
The following are the marks scored by the students in the Summative Assessment exam
| Class | 0 − 10 | 10 − 20 | 20 − 30 | 30 − 40 | 40 − 50 | 50 − 60 |
| No. of Students | 2 | 7 | 15 | 10 | 11 | 5 |
Calculate the median.
Heights of 50 students of class X of a school are recorded and following data is obtained:
| Height (in cm) | 130 – 135 | 135 – 140 | 140 – 145 | 145 – 150 | 150 – 155 | 155 – 160 |
| Number of students | 4 | 11 | 12 | 7 | 10 | 6 |
Find the median height of the students.
The following table gives the monthly consumption of electricity of 100 families:
| Monthly Consumption (in units) |
130 – 140 | 140 – 150 | 150 – 160 | 160 – 170 | 170 – 180 | 180 – 190 | 190 – 200 |
| Number of families |
5 | 9 | 17 | 28 | 24 | 10 | 7 |
Find the median of the above data.
