Advertisements
Advertisements
प्रश्न
The table below shows the salaries of 280 persons :
| Salary (In thousand Rs) | No. of Persons |
| 5 – 10 | 49 |
| 10 – 15 | 133 |
| 15 – 20 | 63 |
| 20 – 25 | 15 |
| 25 – 30 | 6 |
| 30 – 35 | 7 |
| 35 – 40 | 4 |
| 40 – 45 | 2 |
| 45 – 50 | 1 |
Calculate the median salary of the data.
उत्तर
| Salary (In thousand Rs) | Frequency | CF |
| 5 – 10 | 49 | 49 |
| 10 – 15 | 133 | 182 |
| 15 – 20 | 63 | 245 |
| 20 – 25 | 15 | 260 |
| 25 – 30 | 6 | 266 |
| 30 – 35 | 7 | 273 |
| 35 – 40 | 4 | 277 |
| 40 – 45 | 2 | 279 |
| 45 – 50 | 1 | 280 |
`N/2 = 280/2 = 140`
The cumulative frequency which is greater than and nearest to 140 is 182.
Median class = 10-15
We also have,
l (lower limit of median class) = 10
h (class size) = 5
n (number of observations) = 280
cf = (cumulative frequency of the class preceding the median class) = 49
f (frequency of median class) = 133
Median for grouped data is given by the formula :
Median = `l + ((n/2 - cf)/f) xx h`
where f is the frequency of median class and cf is the cumulative frequency of previous class.
Median = `10 + (140 - 49)/133 xx 5 = 13.42`
APPEARS IN
संबंधित प्रश्न
Calculate the median from the following data:
| Rent (in Rs.): | 15 - 25 | 25 - 35 | 35 - 45 | 45 - 55 | 55 - 65 | 65 - 75 | 75 - 85 | 85 - 95 |
| No. of Houses: | 8 | 10 | 15 | 25 | 40 | 20 | 15 | 7 |
If the median of the following data is 32.5, find the missing frequencies.
| Class interval: | 0 - 10 | 10 - 20 | 20 - 30 | 30 - 40 | 40 - 50 | 50 - 60 | 60 - 70 | Total |
| Frequency: | f1 | 5 | 9 | 12 | f2 | 3 | 2 | 40 |
Compute the median for the following data:
| Marks | No. of students |
| Less than 10 | 0 |
| Less than 30 | 10 |
| Less than 50 | 25 |
| Less than 70 | 43 |
| Less than 90 | 65 |
| Less than 110 | 87 |
| Less than 130 | 96 |
| Less than 150 | 100 |
Compute mean from the following data:
| Marks | 0 – 7 | 7 – 14 | 14 – 21 | 21 – 28 | 28 – 35 | 35 – 42 | 42 – 49 |
| Number of Students | 3 | 4 | 7 | 11 | 0 | 16 | 9 |
Calculate the missing frequency from the following distribution, it being given that the median of distribution is 24.
| Class | 0 – 10 | 10 – 20 | 20 – 30 | 30 – 40 | 40 - 50 |
| Frequency | 5 | 25 | ? | 18 | 7 |
Grouped frequency distribution of supply of milk to hotels and the number of hotels is given in the following table. Find the mode of the supply of milk.
| Milk (Litre) | 1 - 3 | 3 - 5 | 5 - 7 | 7 - 9 | 9 - 11 | 11 - 13 |
| No. of hotels | 7 | 5 | 15 | 20 | 35 | 18 |
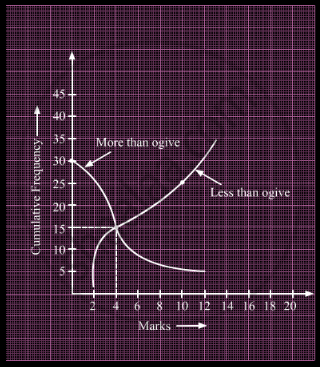
What is the value of the median of the data using the graph in the following figure of less than ogive and more than ogive?

The median of the following observations 11, 12, 14, (x – 2), (x + 4), (x + 9), 32, 38, 47 arranged in ascending order is 24. Find the value of x and hence find the mean.
Find the values of a and b, if the sum of all the frequencies is 120 and the median of the following data is 55.
| Marks | 30 – 40 | 40 – 50 | 50 –60 | 60 – 70 | 70 –80 | 80 – 90 |
| Frequency | a | 40 | 27 | b | 15 | 24 |
The median of the following data is 525. Find the values of x and y, if the total frequency is 100.
| Class interval | Frequency |
| 0 – 100 | 2 |
| 100 – 200 | 5 |
| 200 – 300 | x |
| 300 – 400 | 12 |
| 400 – 500 | 17 |
| 500 – 600 | 20 |
| 600 – 700 | y |
| 700 – 800 | 9 |
| 800 – 900 | 7 |
| 900 – 1000 | 4 |
