Advertisements
Advertisements
Question
The marks obtained by 120 students in a mathematics test is given below:
| Marks | No. of students |
| 0 – 10 | 5 |
| 10 – 20 | 9 |
| 20 – 30 | 16 |
| 30 – 40 | 22 |
| 40 – 50 | 26 |
| 50 – 60 | 18 |
| 60 – 70 | 11 |
| 70 – 80 | 6 |
| 80 – 90 | 4 |
| 90 – 100 | 3 |
Draw an ogive for the given distributions on a graph sheet. Use a suitable scale for your ogive. Use your ogive to estimate:
- the median
- the number of student who obtained more than 75% in test.
- the number of students who did not pass in the test if the pass percentage was 40.
- the lower quartile.
Solution
| Marks | No. of students | c.f. |
| 0 – 10 | 5 | 5 |
| 10 – 20 | 9 | 14 |
| 20 – 30 | 16 | 30 |
| 30 – 40 | 22 | 52 |
| 40 – 50 | 26 | 78 |
| 50 – 60 | 18 | 96 |
| 60 – 70 | 11 | 107 |
| 70 – 80 | 6 | 113 |
| 80 – 90 | 4 | 117 |
| 90 – 100 | 3 | 120 |
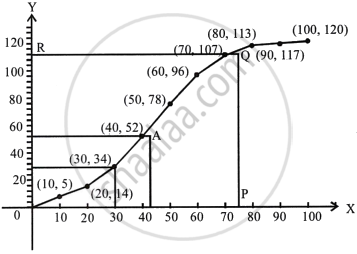
First of all, we plot the points (0, 0), (10, 5), (20, 14), (30, 30), (40, 52), (50, 78), (60, 96), (70, 107), (80, 113), (90, 117), (100, 120) on graph paper and join them by free hand curve to give the required ogive.
Median =
i. Through 60.5th marks, draw a line segment parallel to x-axis which meets the curve at A.
From A, draw a line segment perpendicular to, x-axis meeting at B.
∴ B is the median = 43 ...(approx.)
ii. On x-axis, a point P representing 75, drawn vertical line meeting ogive at Q. From Q draw a ⊥ on y-axis meeting y-axis at R, the ordinate of y be 110.
No. of students who obtained upto 75% marks in the test = 110
∴ No. of students who obtained more than 75% = 120 – 110 = 10
iii. No. of students who obtained less than 40% marks in the test = 52 ...(∴ in the graph x = 40, y = 52)
iv. The lower quartile = (Q1)
=
= 30th term
= 30
From a point B (30) on y-axis, draw a parallel to x-axis meeting the curve at Q and from Q. Draw a line parallel to x-axis meeting it at 30.
∴ Lower Quartile = 30 = Q1.
APPEARS IN
RELATED QUESTIONS
The median is always one of the numbers in a data.
Find the mean of the following frequency distribution by the short cut method :
| Class | 0-10 | 10-20 | 20-30 | 30-40 | 40-50 |
| Frequency | 9 | 12 | 15 | 10 | 14 |
Find the mean of the following frequency distribution by the short cut method :
| Class | 1-10 | 11-20 | 21-30 | 31-40 | 41-50 | 51-60 | 61-70 |
| Frequency | 7 | 10 | 14 | 17 | 15 | 11 | 6 |
Find the mode of the following frequency distribution:
| Pocket money per week in Rs | 25 | 50 | 75 | 100 | 125 | 150 |
| No. of students | 4 | 7 | 13 | 18 | 6 | 2 |
Estimate the median, the lower quartile and the upper quartile of the following frequency distribution by drawing an ogive:
| Age( in yrs) | Under 10 | Under 20 | Under 30 | Under 40 | Under 50 | Under 60 |
| No. of males | 6 | 10 | 25 | 32 | 43 | 50 |
Estimate the median, the lower quartile and the upper quartile of the following frequency distribution by drawing an ogive:
| Marks (less than) | 10 | 20 | 30 | 40 | 50 | 60 | 70 | 80 |
| No. of students | 5 | 15 | 30 | 54 | 72 | 86 | 94 | 100 |
Find the median of:
63, 17, 50, 9, 25, 43, 21, 50, 14 and 34
If the mean of 8, 10, 7, x + 2 and 6 is 9, find the value of x.
Find the mean of: 7, 5, 0, 3, 0, 6, 0, 9, 1 and 4
The weekly sale of motor bikes in a showroom for the past 14 weeks given below. 10, 6, 8, 3, 5, 6, 4, 7, 12, 13, 16, 10, 4, 7. Find the median of the data.
