Advertisements
Advertisements
Question
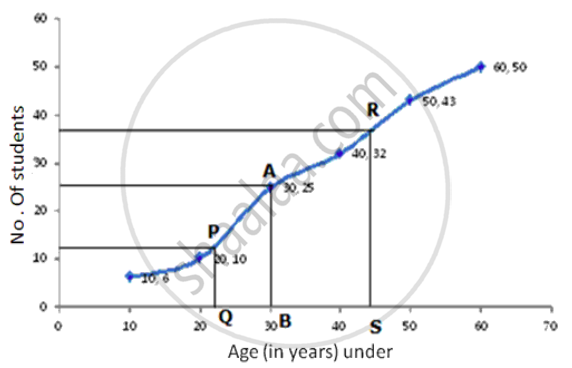
Estimate the median, the lower quartile and the upper quartile of the following frequency distribution by drawing an ogive:
| Age( in yrs) | Under 10 | Under 20 | Under 30 | Under 40 | Under 50 | Under 60 |
| No. of males | 6 | 10 | 25 | 32 | 43 | 50 |
Solution
Given data is cumulative data , so draw the ogive as it is .
| Age (in yrs) Under | No. of males (f) |
| 10 | 6 |
| 20 | 10 |
| 30 | 25 |
| 40 | 32 |
| 50 | 43 |
| 60 | 50 |
Take a graph paper and draw both the axes.
On the x-axis , take a scale of 1cm = 10 to represent the Age (in yrs) under.
On the y-axis , take a scale of 1cm = 10 to represent the no. of males.
Now , plot the points (10,6) , (20,10) , (30,25) ,(40,32) , (50,43) ,(60,5).
Join them by a smooth curve to get the ogive.

No. of terms = 50
∴ Median = `(25+26)/2` = 25.5th term
Through mark of 25.5 on y-axis draw a line parallel to x-axis which meets the curve at A. From A, draw a perpendicular to x-axis which meets it at B.
The value of B is the median which is 30.
Lower Quartile (Q1) = `n/4 = 50/4` = 12.5th term
Through mark of 12.5 on y-axis draw a line parallel to x-axis which meets the curve at P. From a perpendicular to x-axis which meets it at Q.
The value of Q is the lower quartile which is 22.
Upper Quartile (Q3) = `(n xx 3)/4 = (50 xx 3)/4` = 37.5th term
Through mark of 37.5 on y-axis draw a line parallel to x-axis which meets the curve at R. From R, draw a perpendicular to x-axis which meets it at S.
The value of S is the upper quartile which is 44.
APPEARS IN
RELATED QUESTIONS
Find the mean of the following distribution by step deviation method:
| Class Interval | 20-30 | 30-40 | 40-50 | 50-60 | 60-70 | 70-80 |
| Frequency | 10 | 6 | 8 | 12 | 5 | 9 |
A boy scored following marks in various class tests during a term; each test being marked out of 20.
15, 17, 16, 7, 10, 12, 14, 16, 19, 12 and 16
What are his total marks?
The daily wages of 80 workers in a building project are given below :
| Wages (Rs) | No.of workers |
| 30-40 | 6 |
| 40-50 | 10 |
| 50-60 | 15 |
| 60-70 | 19 |
| 70-80 | 12 |
| 80-90 | 8 |
| 90-100 | 6 |
| 100-110 | 4 |
Using graph paper, draw an ogive for the above distribution. Use your ogive, to estimate :
(1) the mediam wages of workers
(2) the percentage of workers who earn more than Rs 75 a day.
(3) the upper quartile wages of the workers
(4) the lower quartile wages of the workers
(5) Inter quartile range
Find the mode of the following:
21, 22, 28, 23, 24, 21 26, 22, 29, 27, 21, 21, 26, 24, 23
The median of observations 10, 11, 13, 17, x + 5, 20, 22, 24 and 53 (arranged in ascending order) is 18; find the value of x.
The pocket expenses (per day) of Anuj, during a certain week, from Monday to Saturday were ₹85.40, ₹88.00, ₹86.50, ₹84.75, ₹82.60 and ₹87.25. Find the mean pocket expenses per day.
Find the median of 3.2, 4.8, 5.6, 5.6, 7.3, 8.9 and 9.1
The median of the data: 3, 4, 5, 6, 7, 3, 4 is ______.
The median of any data lies between the ______ and ______ observations.
The marks of 200 students in a test were recorded as follows:
| Marks % |
0-10 | 10-20 | 20-30 | 30-40 | 40-50 | 50-60 | 60-70 | 70-80 | 80-90 | 90-100 |
| No. of students |
5 | 7 | 11 | 20 | 40 | 52 | 36 | 15 | 9 | 5 |
Using graph sheet draw ogive for the given data and use it to find the,
- median,
- number of students who obtained more than 65% marks
- number of students who did not pass, if the pass percentage was 35.
