Advertisements
Advertisements
Question
The marks of 200 students in a test were recorded as follows:
| Marks % |
0-10 | 10-20 | 20-30 | 30-40 | 40-50 | 50-60 | 60-70 | 70-80 | 80-90 | 90-100 |
| No. of students |
5 | 7 | 11 | 20 | 40 | 52 | 36 | 15 | 9 | 5 |
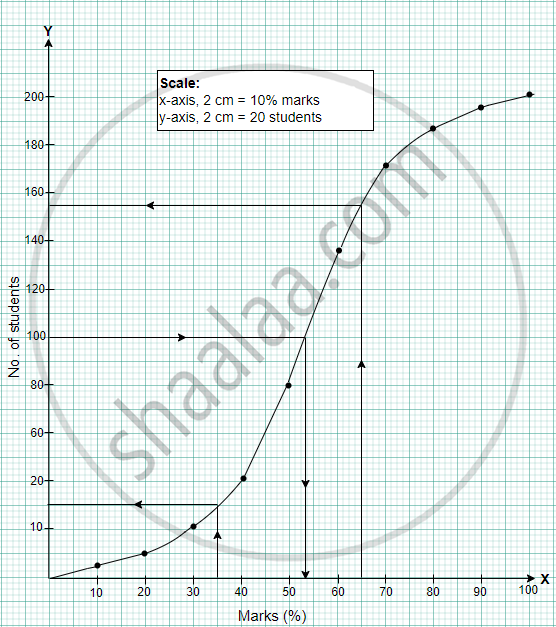
Using graph sheet draw ogive for the given data and use it to find the,
- median,
- number of students who obtained more than 65% marks
- number of students who did not pass, if the pass percentage was 35.
Solution
| Marks (%) | f | cf |
| 0 – 10 | 5 | 5 |
| 10 – 20 | 7 | 12 |
| 20 – 30 | 11 | 23 |
| 30 – 40 | 20 | 43 |
| 40 – 50 | 40 | 83 |
| 50 – 60 | 52 | 135 |
| 60 – 70 | 36 | 171 |
| 70 – 80 | 15 | 186 |
| 80 – 90 | 09 | 195 |
| 90 – 100 | 05 | 200 |
- Median = 53 ± 1
- More than 65% = 46 ± 2
- Didn't pass = 31 ± 2
APPEARS IN
RELATED QUESTIONS
The following table gives the heights of plants in centimeter. If the mean height of plants is 60.95 cm; find the value of 'f'.
| Height (cm) | 50 | 55 | 58 | 60 | 65 | 70 | 71 |
| No. of plants | 2 | 4 | 10 | f | 5 | 4 | 3 |
Find mean by step-deviation method:
| C.I. | 63 – 70 | 70 – 77 | 77 – 84 | 84 – 91 | 91 – 98 | 98 – 105 | 105 – 112 |
| Frequency | 9 | 13 | 27 | 38 | 32 | 16 | 15 |
Attempt this question on a graph paper. The table shows the distribution of marks gained by a group of 400 students in an examination.
|
Marks (Less than ) |
10 | 20 | 30 | 40 | 50 | 60 | 70 | 80 | 90 | 100 |
| No.of student | 5 | 10 | 30 | 60 | 105 | 180 | 270 | 355 | 390 | 400 |
Using scaie of 2cm to represent 10 marks and 2 cm to represent 50 student, plot these point and draw a smooth curve though the point
Estimate from the graph :
(1)the median marks
(2)the quartile marks.
Draw an ogive for the data given below and from the graph determine:
- the median marks
- the number of students who obtained more than 75% marks
| Marks | No. of students |
| 0 – 9 | 5 |
| 10 – 19 | 9 |
| 20 – 29 | 16 |
| 30 – 39 | 22 |
| 40 – 49 | 26 |
| 50 – 59 | 18 |
| 60 – 69 | 11 |
| 70 – 79 | 6 |
| 80 – 89 | 4 |
| 90 – 99 | 3 |
Using a graph paper, draw an ogive for the following distribution which shows a record of the width in kilograms of 200 students.
| Weight | Frequency |
| 40 – 45 | 5 |
| 45 – 50 | 17 |
| 50 – 55 | 22 |
| 55 – 60 | 45 |
| 60 – 65 | 51 |
| 65 – 70 | 31 |
| 70 – 75 | 20 |
| 75 – 80 | 9 |
Use your ogive to estimate the following:
- The percentage of student weighting 55 kg or more
- The weight above which the heaviest 30% of the student fall
- The number of students who are
- underweight
- overweight, If 55.70 kg is considered as standard weight.
Find the mode of the following:
21, 22, 28, 23, 24, 21 26, 22, 29, 27, 21, 21, 26, 24, 23
The following data have been arranged in ascending order. If their median is 63, find the value of x.
34, 37, 53, 55, x, x + 2, 77, 83, 89 and 100.
Find the mean of squares of first five whole numbers.
The following data has been arranged in ascending order.
0, 1, 2, 3, x + 1, x + 5, 20, 21, 26, 29.
Find the value of x, if the median is 5.
Find the median of the 10 observations 36, 33, 45, 28, 39, 45, 54, 23, 56, 25. If another observation 35 is added to the above data, what would be the new median?
