Advertisements
Advertisements
प्रश्न
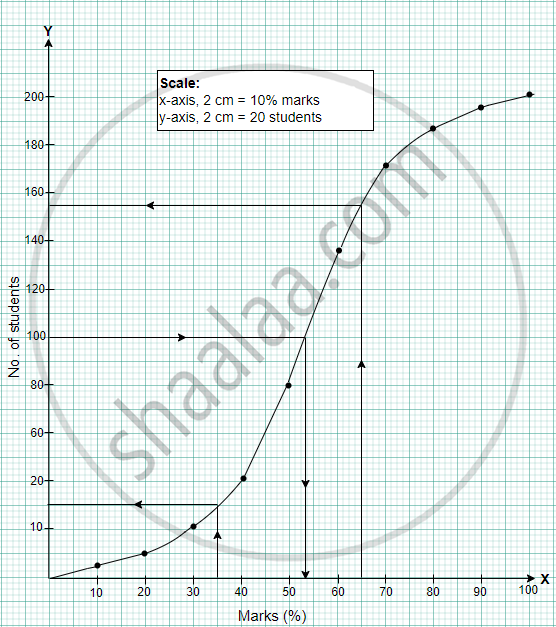
The marks of 200 students in a test were recorded as follows:
| Marks % |
0-10 | 10-20 | 20-30 | 30-40 | 40-50 | 50-60 | 60-70 | 70-80 | 80-90 | 90-100 |
| No. of students |
5 | 7 | 11 | 20 | 40 | 52 | 36 | 15 | 9 | 5 |
Using graph sheet draw ogive for the given data and use it to find the,
- median,
- number of students who obtained more than 65% marks
- number of students who did not pass, if the pass percentage was 35.
उत्तर
| Marks (%) | f | cf |
| 0 – 10 | 5 | 5 |
| 10 – 20 | 7 | 12 |
| 20 – 30 | 11 | 23 |
| 30 – 40 | 20 | 43 |
| 40 – 50 | 40 | 83 |
| 50 – 60 | 52 | 135 |
| 60 – 70 | 36 | 171 |
| 70 – 80 | 15 | 186 |
| 80 – 90 | 09 | 195 |
| 90 – 100 | 05 | 200 |
- Median = 53 ± 1
- More than 65% = 46 ± 2
- Didn't pass = 31 ± 2

APPEARS IN
संबंधित प्रश्न
From the data given below, calculate the mean wage, correct to the nearest rupee.
| Category | A | B | C | D | E | F |
| Wages (Rs/day) | 50 | 60 | 70 | 80 | 90 | 100 |
| No. of workers | 2 | 4 | 8 | 12 | 10 | 6 |
- If the number of workers in each category is doubled, what would be the new mean wage?
- If the wages per day in each category are increased by 60%; what is the new mean wage?
- If the number of workers in each category is doubled and the wages per day per worker are reduced by 40%, what would be the new mean wage?
The marks obtained by 120 students in a mathematics test is given below:
| Marks | No. of students |
| 0 – 10 | 5 |
| 10 – 20 | 9 |
| 20 – 30 | 16 |
| 30 – 40 | 22 |
| 40 – 50 | 26 |
| 50 – 60 | 18 |
| 60 – 70 | 11 |
| 70 – 80 | 6 |
| 80 – 90 | 4 |
| 90 – 100 | 3 |
Draw an ogive for the given distributions on a graph sheet. Use a suitable scale for your ogive. Use your ogive to estimate:
- the median
- the number of student who obtained more than 75% in test.
- the number of students who did not pass in the test if the pass percentage was 40.
- the lower quartile.
Following 10 observations are arranged in ascending order as follows.
2, 3, 5, 9, x + 1, x + 3, 14, 16, 19, 20
If the median of the data is 11, find the value of x.
Draw a histogram for the following distribution and estimate the mode:
| I.Q. Score | 80-100 | 100-120 | 120-140 | 140-160 | 160-180 | 180-200 |
| No. of Students | 6 | 9 | 16 | 13 | 4 | 2 |
Estimate the median, the lower quartile and the upper quartile of the following frequency distribution by drawing an ogive:
| Marks(more than) | 90 | 80 | 70 | 60 | 50 | 40 | 30 | 20 | 10 | 0 |
| No. of students | 6 | 13 | 22 | 34 | 48 | 60 | 70 | 78 | 80 | 80 |
The mean of a certain number of observations is 32. Find the resulting mean, if the observation is, decreased by 7
The mean of marks scored by 100 students was found to be 40, later on, it was discovered that a score of 53 was misread as 83. Find the correct mean.
Find the mean of: 5, 2.4, 6.2, 8.9, 4.1 and 3.4
Find the mean and the median of: 10,12, 12, 15, 15, 17, 18, 18, 18 and 19
The measures of central tendency may not lie between the maximum and minimum values of data.
