Advertisements
Advertisements
Question
Attempt this question on a graph paper. The table shows the distribution of marks gained by a group of 400 students in an examination.
|
Marks (Less than ) |
10 | 20 | 30 | 40 | 50 | 60 | 70 | 80 | 90 | 100 |
| No.of student | 5 | 10 | 30 | 60 | 105 | 180 | 270 | 355 | 390 | 400 |
Using scaie of 2cm to represent 10 marks and 2 cm to represent 50 student, plot these point and draw a smooth curve though the point
Estimate from the graph :
(1)the median marks
(2)the quartile marks.
Solution 1
| Marks (less than) | No.of students |
| 10 | 5 |
| 20 | 10 |
| 30 | 30 |
| 40 | 60 |
| 50 | 105 |
| 60 | 180 |
| 70 | 270 |
| 80 | 355 |
| 90 | 390 |
| 100 | 400 |
Number of terms=400
 ∴ Median= `400/2=200^("th")` term
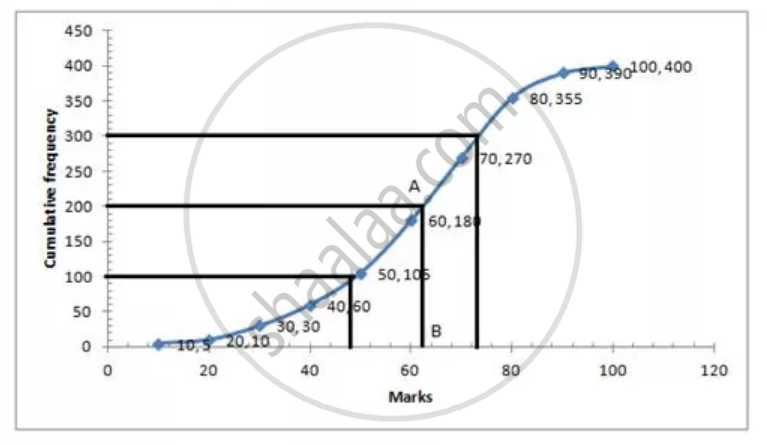
Through 200th term mark draw a line parallel to the x-axis which meets the curve at A. draw a prependiculer to x-axis which meet it at B value of B is the median = 62
Lower Quartile = `Q_1=400/4=100^("th")` term=49
Upper Quartile= `400xx3/4=300^("th")` term=74
Solution 2
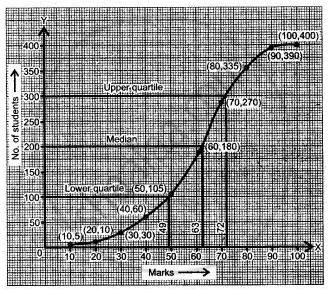
By plotting the points (10, 5), (20, 10), (30, 30), (40, 60), (50, 105), (60, 180), (70, 270), (80, 335), (90, 390) and (100, 400), we get the ogive for the given frequency table, as shown in the figure.
Scale: 2 cm to represent 10 marks
2 cm to represent 50 students.
(i) To find the median, we shall draw a horizontal line at c.f. = `"N"/(2) = (400)/(2)` = 200. Intersecting the ogive at the point (200, 63).
Hence the median is 63.
(ii) To find the lower quartile, we shall construct a horizontal line at c.f. `"N"/(2) = (400)/(2)` = 100, intersecting the ogive at the point (49, 100). Hence, 49 is the lower line at c.f. `(3"N")/(4) = (3 xx 400)/(4)` = 300.
Intersecting the ogive at the point (300, 72). Hence, the upper quartile mark is 72.
APPEARS IN
RELATED QUESTIONS
If the mean of 6, 4, 7, ‘a’ and 10 is 8. Find the value of ‘a’
The following table gives the age of 50 student of a class. Find the arithmetic mean of their ages.
| Age-years | 16 – 18 | 18 – 20 | 20 – 22 | 22 – 24 | 24 – 26 |
| No. of students | 2 | 7 | 21 | 17 | 3 |
By drawing an ogive, estimate the median for the following frequency distribution:
| Weight (kg) | 10 – 15 | 15 – 20 | 20 – 25 | 25 – 30 | 30 – 35 |
| No. of boys | 11 | 25 | 12 | 5 | 2 |
From the following cumulative frequency table, draw ogive and then use it to find:
- Median
- Lower quartile
- Upper quartile
| Marks (less than) | 10 | 20 | 30 | 40 | 50 | 60 | 70 | 80 | 90 | 100 |
| Cumulative frequency | 5 | 24 | 37 | 40 | 42 | 48 | 70 | 77 | 79 | 80 |
Draw a histogram and hence estimate the mode for the following frequency distribution:
| Class | 0-10 | 10-20 | 20-30 | 30-40 | 40-50 | 50-60 |
| Freq | 2 | 8 | 10 | 5 | 4 | 3 |
Find the median of all prime numbers between 20 and 50
Estimate the median, the lower quartile and the upper quartile of the following frequency distribution by drawing an ogive:
| Class Interval | 0-10 | 10-20 | 20-30 | 30-40 | 40-50 | 50-60 | 60-70 |
| Frequency | 4 | 12 | 21 | 18 | 15 | 7 | 3 |
The heights (in cm) of 8 girls of a class are 140, 142, 135, 133, 137, 150, 148 and 138 respectively. Find the mean height of these girls and their median height.
Find the mean and the median of: 10,12, 12, 15, 15, 17, 18, 18, 18 and 19
Find the median of the given data if the mean is 4.5.
5, 7, 7, 8, x, 5, 4, 3, 1, 2
