Advertisements
Advertisements
प्रश्न
Attempt this question on a graph paper. The table shows the distribution of marks gained by a group of 400 students in an examination.
|
Marks (Less than ) |
10 | 20 | 30 | 40 | 50 | 60 | 70 | 80 | 90 | 100 |
| No.of student | 5 | 10 | 30 | 60 | 105 | 180 | 270 | 355 | 390 | 400 |
Using scaie of 2cm to represent 10 marks and 2 cm to represent 50 student, plot these point and draw a smooth curve though the point
Estimate from the graph :
(1)the median marks
(2)the quartile marks.
उत्तर १
| Marks (less than) | No.of students |
| 10 | 5 |
| 20 | 10 |
| 30 | 30 |
| 40 | 60 |
| 50 | 105 |
| 60 | 180 |
| 70 | 270 |
| 80 | 355 |
| 90 | 390 |
| 100 | 400 |
Number of terms=400
 ∴ Median= `400/2=200^("th")` term
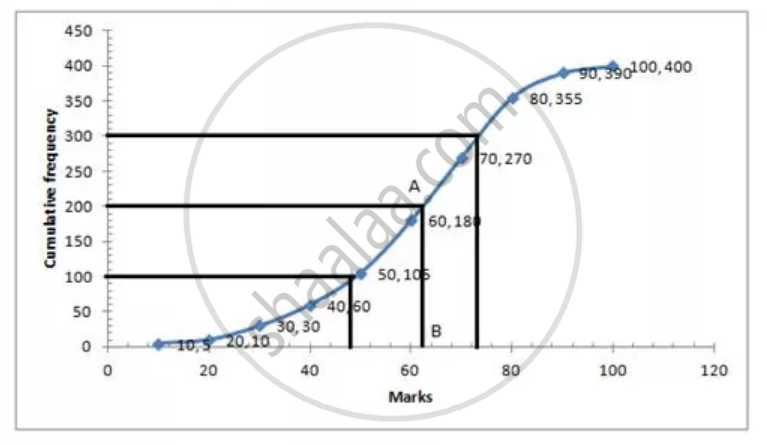
Through 200th term mark draw a line parallel to the x-axis which meets the curve at A. draw a prependiculer to x-axis which meet it at B value of B is the median = 62
Lower Quartile = `Q_1=400/4=100^("th")` term=49
Upper Quartile= `400xx3/4=300^("th")` term=74
उत्तर २
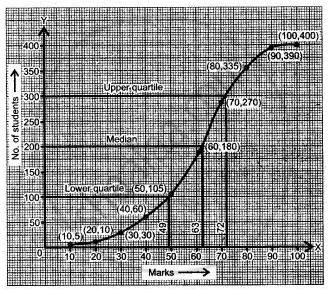
By plotting the points (10, 5), (20, 10), (30, 30), (40, 60), (50, 105), (60, 180), (70, 270), (80, 335), (90, 390) and (100, 400), we get the ogive for the given frequency table, as shown in the figure.
Scale: 2 cm to represent 10 marks
2 cm to represent 50 students.
(i) To find the median, we shall draw a horizontal line at c.f. = `"N"/(2) = (400)/(2)` = 200. Intersecting the ogive at the point (200, 63).
Hence the median is 63.
(ii) To find the lower quartile, we shall construct a horizontal line at c.f. `"N"/(2) = (400)/(2)` = 100, intersecting the ogive at the point (49, 100). Hence, 49 is the lower line at c.f. `(3"N")/(4) = (3 xx 400)/(4)` = 300.
Intersecting the ogive at the point (300, 72). Hence, the upper quartile mark is 72.
APPEARS IN
संबंधित प्रश्न
Using a graph paper draw a histogram of the given distribution showing the number of runs scored by 50 batsmen. Estimate the mode of the data:
| Runs scored |
3000- 4000 |
4000- 5000 |
5000- 6000 |
6000- 7000 |
7000- 8000 |
8000- 9000 |
9000- 10000 |
| No. of batsmen |
4 | 18 | 9 | 6 | 7 | 2 | 4 |
A boy scored following marks in various class tests during a term; each test being marked out of 20.
15, 17, 16, 7, 10, 12, 14, 16, 19, 12 and 16
What are his modal marks?
A boy scored following marks in various class tests during a term; each test being marked out of 20.
15, 17, 16, 7, 10, 12, 14, 16, 19, 12 and 16
What are his total marks?
Find the mean of the following frequency distribution by the short cut method :
| Class | 1-10 | 11-20 | 21-30 | 31-40 | 41-50 | 51-60 | 61-70 |
| Frequency | 7 | 10 | 14 | 17 | 15 | 11 | 6 |
Find the median of the following:
25, 34, 31, 23, 22, 26, 35, 29, 20, 32
Estimate the median, the lower quartile and the upper quartile of the following frequency distribution by drawing an ogive:
| Marks (less than) | 10 | 20 | 30 | 40 | 50 | 60 | 70 | 80 |
| No. of students | 5 | 15 | 30 | 54 | 72 | 86 | 94 | 100 |
The mean of a certain number of observations is 32. Find the resulting mean, if the observation is, increased by 3
Find the mean and the median of: 0.5, 5.6, 3.8, 4.9, 2.7 and 4.4
Find the median of the given data: 35, 25, 34, 36, 45, 18, 28
The median of the data 24, 29, 34, 38, 35 and 30, is ___________
