Advertisements
Advertisements
प्रश्न
Attempt this question on a graph paper. The table shows the distribution of marks gained by a group of 400 students in an examination.
|
Marks (Less than ) |
10 | 20 | 30 | 40 | 50 | 60 | 70 | 80 | 90 | 100 |
| No.of student | 5 | 10 | 30 | 60 | 105 | 180 | 270 | 355 | 390 | 400 |
Using scaie of 2cm to represent 10 marks and 2 cm to represent 50 student, plot these point and draw a smooth curve though the point
Estimate from the graph :
(1)the median marks
(2)the quartile marks.
उत्तर १
| Marks (less than) | No.of students |
| 10 | 5 |
| 20 | 10 |
| 30 | 30 |
| 40 | 60 |
| 50 | 105 |
| 60 | 180 |
| 70 | 270 |
| 80 | 355 |
| 90 | 390 |
| 100 | 400 |
Number of terms=400
 ∴ Median= `400/2=200^("th")` term
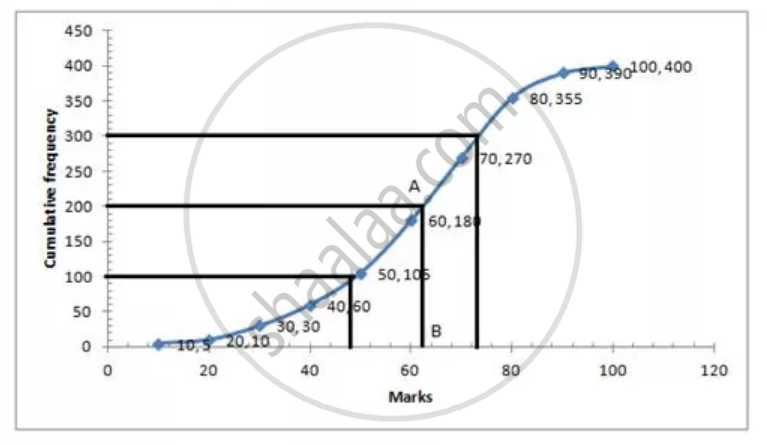
Through 200th term mark draw a line parallel to the x-axis which meets the curve at A. draw a prependiculer to x-axis which meet it at B value of B is the median = 62
Lower Quartile = `Q_1=400/4=100^("th")` term=49
Upper Quartile= `400xx3/4=300^("th")` term=74
उत्तर २
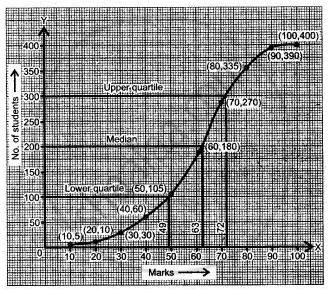
By plotting the points (10, 5), (20, 10), (30, 30), (40, 60), (50, 105), (60, 180), (70, 270), (80, 335), (90, 390) and (100, 400), we get the ogive for the given frequency table, as shown in the figure.
Scale: 2 cm to represent 10 marks
2 cm to represent 50 students.
(i) To find the median, we shall draw a horizontal line at c.f. = `"N"/(2) = (400)/(2)` = 200. Intersecting the ogive at the point (200, 63).
Hence the median is 63.
(ii) To find the lower quartile, we shall construct a horizontal line at c.f. `"N"/(2) = (400)/(2)` = 100, intersecting the ogive at the point (49, 100). Hence, 49 is the lower line at c.f. `(3"N")/(4) = (3 xx 400)/(4)` = 300.
Intersecting the ogive at the point (300, 72). Hence, the upper quartile mark is 72.
APPEARS IN
संबंधित प्रश्न
If the mean of the following observations is 54, find the value of p.
| Class | 0 – 20 | 20 – 40 | 40 – 60 | 60 – 80 | 80 – 100 |
| Frequency | 7 | p | 10 | 9 | 13 |
Find the median and mode for the set of numbers:
2, 2, 3, 5, 5, 5, 6, 8 and 9
In a malaria epidemic, the number of cases diagnosed were as follows:
| Date July | 1 | 2 | 3 | 4 | 5 | 6 | 7 | 8 | 9 | 10 | 11 | 12 |
| Num | 5 | 12 | 20 | 27 | 46 | 30 | 31 | 18 | 11 | 5 | 0 | 1 |
On what days do the mode and upper and lower quartiles occur?
Find the mean of the following frequency distribution :
| Class | 0-10 | 10-20 | 20-30 | 30-40 | 40-50 |
| Frequency | 4 | 7 | 6 | 3 | 5 |
Find the mode of the following:
6, 7, 1, 8,6,5, 9, 4, 6, 7, 1,3, 2, 6, 7,8
The percentage marks obtained in 10 subjects by a student are 84, 88, 72, 91, 68, 75, 98, 96, 79 and 86. Find the median of the marks obtained.
In 10 numbers, arranged in increasing order, the 7th number is increased by 8, how much will the median be changed?
The pocket expenses (per day) of Anuj, during a certain week, from Monday to Saturday were ₹85.40, ₹88.00, ₹86.50, ₹84.75, ₹82.60 and ₹87.25. Find the mean pocket expenses per day.
The following data has been arranged in ascending order.
0, 1, 2, 3, x + 1, x + 5, 20, 21, 26, 29.
Find the value of x, if the median is 5.
The number of goals scored by a football team is given below. Find the mode and median for the data of 2, 3, 2, 4, 6, 1, 3, 2, 4, 1, 6
