Advertisements
Advertisements
Question
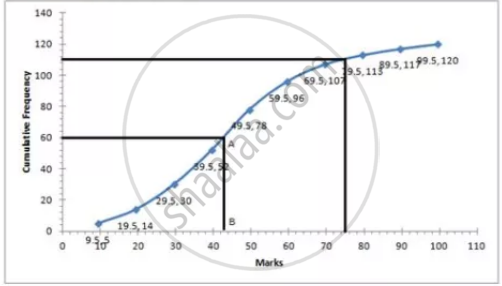
Draw an ogive for the data given below and from the graph determine:
- the median marks
- the number of students who obtained more than 75% marks
| Marks | No. of students |
| 0 – 9 | 5 |
| 10 – 19 | 9 |
| 20 – 29 | 16 |
| 30 – 39 | 22 |
| 40 – 49 | 26 |
| 50 – 59 | 18 |
| 60 – 69 | 11 |
| 70 – 79 | 6 |
| 80 – 89 | 4 |
| 90 – 99 | 3 |
Solution
| Marks | No. of students | Cumulative frequency |
| 0.5 – 9.5 | 5 | 5 |
| 9.5 – 19.5 | 9 | 14 |
| 19.5 – 29.5 | 16 | 30 |
| 29.5 – 39.5 | 22 | 52 |
| 39.5 – 49.5 | 26 | 78 |
| 49.5 – 59.5 | 18 | 96 |
| 59.5 – 69.5 | 11 | 107 |
| 69.5 – 79.5 | 6 | 113 |
| 79.5 – 89.5 | 4 | 117 |
| 89.5 – 99.5 | 3 | 120 |
Total number of terms = 120
 i. i. ∴ Median = `120/2` = 60th term
Through mark 60, draw a parallel line to x-axis which meets the curve at A. From A, draw a perpendicular to x-axis meeting it at B.
The value of point B is the median = 43
ii. Total marks = 100
75% of total marks = `75/100 xx 100 = 75`
The number of students getting more than 75% marks = 120 – 111 = 9
RELATED QUESTIONS
Marks obtained (in mathematics) by 9 students are given below:
60, 67, 52, 76, 50, 51, 74, 45 and 56
- Find the arithmetic mean.
- If marks of each student be increased by 4; what will be the new value of arithmetic mean?
From the data given below, calculate the mean wage, correct to the nearest rupee.
| Category | A | B | C | D | E | F |
| Wages (Rs/day) | 50 | 60 | 70 | 80 | 90 | 100 |
| No. of workers | 2 | 4 | 8 | 12 | 10 | 6 |
- If the number of workers in each category is doubled, what would be the new mean wage?
- If the wages per day in each category are increased by 60%; what is the new mean wage?
- If the number of workers in each category is doubled and the wages per day per worker are reduced by 40%, what would be the new mean wage?
The contents of 100 match boxes were checked to determine the number of matches they contained.
| No. of matches | 35 | 36 | 37 | 38 | 39 | 40 | 41 |
| No. of boxes | 6 | 10 | 18 | 25 | 21 | 12 | 8 |
- Calculate, correct to one decimal place, the mean number of matches per box.
- Determine, how many extra matches would have to be added to the total contents of the 100 boxes to bring the mean up to exactly 39 matches.
Attempt this question on graph paper.
| Age (yrs ) | 5-15 | 15-25 | 25-35 | 35-45 | 45-55 | 55-65 | 65-75 |
| No.of casualties | 6 | 10 | 15 | 13 | 24 | 8 | 7 |
(1) Construct the 'less than' Cumulative frequency curve for the above data. using 2 cm =10 years on one axis and 2 cm =10 casualties on the other.
(2)From your graph determine :
(a)the median
(b)the lower quartile
Estimate the median, the lower quartile and the upper quartile of the following frequency distribution by drawing an ogive:
| Marks(more than) | 90 | 80 | 70 | 60 | 50 | 40 | 30 | 20 | 10 | 0 |
| No. of students | 6 | 13 | 22 | 34 | 48 | 60 | 70 | 78 | 80 | 80 |
Find the mean of: 12, 9, 6,11 and 17
Find the mean of: 2.1, 4.5, 5.2, 7.1 and 9.3
Find the mean and the median of: 1.2, 1.9, 2.2, 2.6 and 2.9
If the median of a, 2a, 4a, 6a, 9a is 8, then find the value of a is
The marks of 200 students in a test were recorded as follows:
| Marks % |
0-10 | 10-20 | 20-30 | 30-40 | 40-50 | 50-60 | 60-70 | 70-80 | 80-90 | 90-100 |
| No. of students |
5 | 7 | 11 | 20 | 40 | 52 | 36 | 15 | 9 | 5 |
Using graph sheet draw ogive for the given data and use it to find the,
- median,
- number of students who obtained more than 65% marks
- number of students who did not pass, if the pass percentage was 35.
