Advertisements
Advertisements
प्रश्न
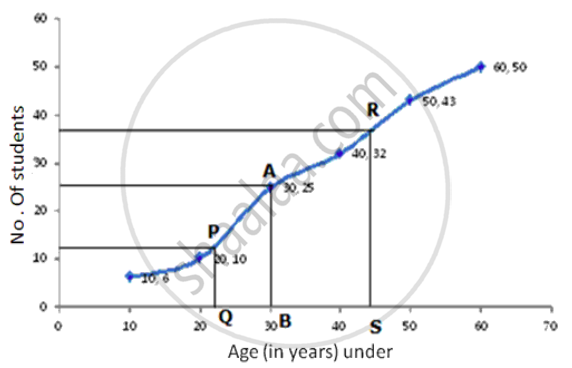
Estimate the median, the lower quartile and the upper quartile of the following frequency distribution by drawing an ogive:
| Age( in yrs) | Under 10 | Under 20 | Under 30 | Under 40 | Under 50 | Under 60 |
| No. of males | 6 | 10 | 25 | 32 | 43 | 50 |
उत्तर
Given data is cumulative data , so draw the ogive as it is .
| Age (in yrs) Under | No. of males (f) |
| 10 | 6 |
| 20 | 10 |
| 30 | 25 |
| 40 | 32 |
| 50 | 43 |
| 60 | 50 |
Take a graph paper and draw both the axes.
On the x-axis , take a scale of 1cm = 10 to represent the Age (in yrs) under.
On the y-axis , take a scale of 1cm = 10 to represent the no. of males.
Now , plot the points (10,6) , (20,10) , (30,25) ,(40,32) , (50,43) ,(60,5).
Join them by a smooth curve to get the ogive.
No. of terms = 50
∴ Median = `(25+26)/2` = 25.5th term
Through mark of 25.5 on y-axis draw a line parallel to x-axis which meets the curve at A. From A, draw a perpendicular to x-axis which meets it at B.
The value of B is the median which is 30.
Lower Quartile (Q1) = `n/4 = 50/4` = 12.5th term
Through mark of 12.5 on y-axis draw a line parallel to x-axis which meets the curve at P. From a perpendicular to x-axis which meets it at Q.
The value of Q is the lower quartile which is 22.
Upper Quartile (Q3) = `(n xx 3)/4 = (50 xx 3)/4` = 37.5th term
Through mark of 37.5 on y-axis draw a line parallel to x-axis which meets the curve at R. From R, draw a perpendicular to x-axis which meets it at S.
The value of S is the upper quartile which is 44.
APPEARS IN
संबंधित प्रश्न
If each number given in (a) is diminished by 2, find the new value of mean.
The following table gives the heights of plants in centimeter. If the mean height of plants is 60.95 cm; find the value of 'f'.
| Height (cm) | 50 | 55 | 58 | 60 | 65 | 70 | 71 |
| No. of plants | 2 | 4 | 10 | f | 5 | 4 | 3 |
From the data given below, calculate the mean wage, correct to the nearest rupee.
| Category | A | B | C | D | E | F |
| Wages (Rs/day) | 50 | 60 | 70 | 80 | 90 | 100 |
| No. of workers | 2 | 4 | 8 | 12 | 10 | 6 |
- If the number of workers in each category is doubled, what would be the new mean wage?
- If the wages per day in each category are increased by 60%; what is the new mean wage?
- If the number of workers in each category is doubled and the wages per day per worker are reduced by 40%, what would be the new mean wage?
Find the mode of following data, using a histogram:
| Class | 0 – 10 | 10 – 20 | 20 – 30 | 30 – 40 | 40 – 50 |
| Frequency | 5 | 12 | 20 | 9 | 4 |
Draw a histogram for the following distribution and estimate the mode:
| Marks% | 30-39 | 40-49 | 50-59 | 60-69 | 70-79 | 80-89 | 90-99 |
| No. of students | 14 | 26 | 40 | 92 | 114 | 78 | 36 |
Find the median of the following:
25, 34, 31, 23, 22, 26, 35, 29, 20, 32
Find the mean of: 2.1, 4.5, 5.2, 7.1 and 9.3
Find the mean of: all prime numbers between 20 and 40.
Calculate the median of the following sets of number:
1, 9, 10, 8, 2, 4, 4, 3, 9, 1, 5, 6, 2 and 4.
In a given data, arranged in ascending or descending order, the middle most observation is called ______.
