Advertisements
Advertisements
प्रश्न
Find the mode of following data, using a histogram:
| Class | 0 – 10 | 10 – 20 | 20 – 30 | 30 – 40 | 40 – 50 |
| Frequency | 5 | 12 | 20 | 9 | 4 |
उत्तर
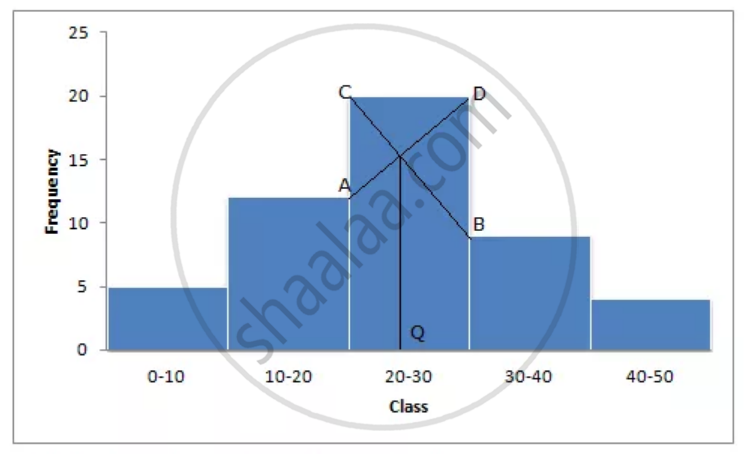
Mode is in 20 – 30, because in this class there are 20 frequencies.
APPEARS IN
संबंधित प्रश्न
Find the mean of the following distribution by step deviation method:
| Class Interval | 20-30 | 30-40 | 40-50 | 50-60 | 60-70 | 70-80 |
| Frequency | 10 | 6 | 8 | 12 | 5 | 9 |
The marks of 20 students in a test were as follows:
2, 6, 8, 9, 10, 11, 11, 12, 13, 13, 14, 14, 15, 15, 15, 16, 16, 18, 19 and 20.
Calculate:
- the mean
- the median
- the mode
Find the median of the following:
25, 34, 31, 23, 22, 26, 35, 29, 20, 32
The following data have been arranged in ascending order. If their median is 63, find the value of x.
34, 37, 53, 55, x, x + 2, 77, 83, 89 and 100.
Find the mean of all factors of 10.
The mean of a certain number of observations is 32. Find the resulting mean, if the observation is, divided by 0.5
The mean of five numbers is 27. If one number is excluded, the mean of the remaining numbers is 25. Find the excluded number.
Find the median of 9, 3, 20, 13, 0, 7 and 10
Find the median of 3.6, 9.4, 3.8, 5.6, 6.5, 8.9, 2.7, 10.8, 15.6, 1.9 and 7.6.
3, 8, 10, x, 14, 16, 18, 20 are in the ascending order and their median is 13. Calculate the numerical value of x.
