Advertisements
Advertisements
प्रश्न
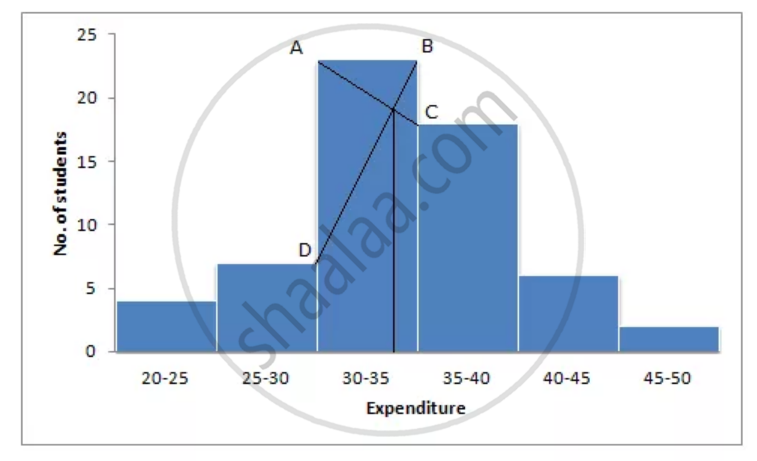
The following table shows the expenditure of 60 boys on books. Find the mode of their expenditure:
| Expenditure (Rs) | No. of students |
| 20 – 25 | 4 |
| 25 – 30 | 7 |
| 30 – 35 | 23 |
| 35 – 40 | 18 |
| 40 – 45 | 6 |
| 45 – 50 | 2 |
उत्तर

Mode is in 30 – 35 because it has the maximum frequency.
APPEARS IN
संबंधित प्रश्न
The following table gives the age of 50 student of a class. Find the arithmetic mean of their ages.
| Age-years | 16 – 18 | 18 – 20 | 20 – 22 | 22 – 24 | 24 – 26 |
| No. of students | 2 | 7 | 21 | 17 | 3 |
The following table gives the weekly wages of workers in a factory.
| Weekly wages (Rs) | No. of workers |
| 50 – 55 | 5 |
| 55 – 60 | 20 |
| 60 – 65 | 10 |
| 65 – 70 | 10 |
| 70 – 75 | 9 |
| 75 – 80 | 6 |
| 80 – 85 | 12 |
| 85 – 90 | 8 |
Calculate the mean by using:
Short-cut method
A boy scored following marks in various class tests during a term; each test being marked out of 20.
15, 17, 16, 7, 10, 12, 14, 16, 19, 12 and 16
What are his median marks?
Find the mean of the following frequency distribution :
| Class | 25-35 | 35-45 | 45-55 | 55-65 | 65-75 |
| Frequency | 6 | 10 | 8 | 12 | 4 |
Find the mean of the following frequency distribution by the step deviation method :
| Class | 100-110 | 110-120 | 120-130 | 130-140 | 140-150 |
| Frequency | 15 | 18 | 32 | 25 | 10 |
Estimate the median, the lower quartile and the upper quartile of the following frequency distribution by drawing an ogive:
| Class Interval | 0-10 | 10-20 | 20-30 | 30-40 | 40-50 | 50-60 | 60-70 |
| Frequency | 4 | 12 | 21 | 18 | 15 | 7 | 3 |
Find the mean of 35, 44, 31, 57, 38, 29, 26,36, 41 and 43.
Find the mean and the median of: 5, 8, 10, 11,13, 16, 19 and 20
Median of the data may or may not be from the given data.
The marks of 200 students in a test were recorded as follows:
| Marks % |
0-10 | 10-20 | 20-30 | 30-40 | 40-50 | 50-60 | 60-70 | 70-80 | 80-90 | 90-100 |
| No. of students |
5 | 7 | 11 | 20 | 40 | 52 | 36 | 15 | 9 | 5 |
Using graph sheet draw ogive for the given data and use it to find the,
- median,
- number of students who obtained more than 65% marks
- number of students who did not pass, if the pass percentage was 35.
