Advertisements
Advertisements
Question
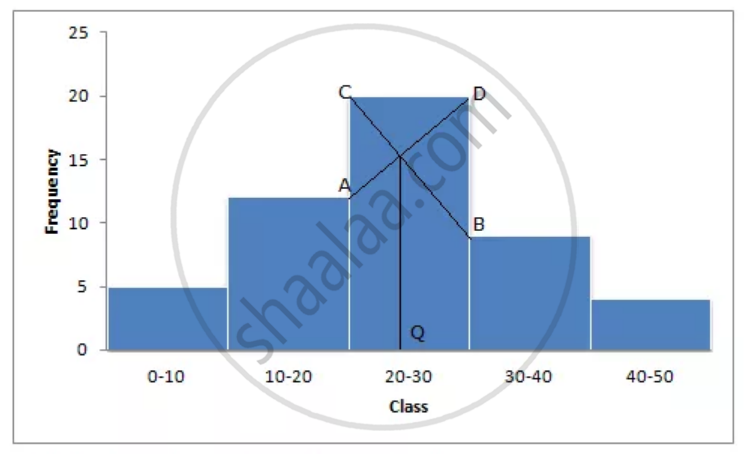
Find the mode of following data, using a histogram:
| Class | 0 – 10 | 10 – 20 | 20 – 30 | 30 – 40 | 40 – 50 |
| Frequency | 5 | 12 | 20 | 9 | 4 |
Solution

Mode is in 20 – 30, because in this class there are 20 frequencies.
APPEARS IN
RELATED QUESTIONS
Find the mean of the following set of numbers:
6, 9, 11, 12 and 7
Marks obtained (in mathematics) by 9 students are given below:
60, 67, 52, 76, 50, 51, 74, 45 and 56
- Find the arithmetic mean.
- If marks of each student be increased by 4; what will be the new value of arithmetic mean?
The ages of 40 students are given in the following table :
| Age (in years) | 12 | 13 | 14 | 15 | 16 | 17 | 18 |
| Frequency | 2 | 4 | 6 | 9 | 8 | 7 | 4 |
Find the arithmetic mean.
find the mean for the following frequency distribution:
| C.I | 0-50 | 50-100 | 100-150 | 150-200 | 200-250 | 250-300 |
| Freq | 4 | 8 | 16 | 13 | 6 | 3 |
Using a graph paper, draw an ogive for the following distribution which shows a record of the width in kilograms of 200 students.
| Weight | Frequency |
| 40 – 45 | 5 |
| 45 – 50 | 17 |
| 50 – 55 | 22 |
| 55 – 60 | 45 |
| 60 – 65 | 51 |
| 65 – 70 | 31 |
| 70 – 75 | 20 |
| 75 – 80 | 9 |
Use your ogive to estimate the following:
- The percentage of student weighting 55 kg or more
- The weight above which the heaviest 30% of the student fall
- The number of students who are
- underweight
- overweight, If 55.70 kg is considered as standard weight.
Find the mean of all numbers from 7 to 17.
The marks of 200 students in a test is given below :
| Marks% | 10-19 | 20-29 | 30-39 | 40-49 | 50-59 | 60-69 | 70-79 | 80-89 |
| No. of Students | 7 | 11 | 20 | 46 | 57 | 37 | 15 | 7 |
Draw an ogive and find the number of students who scored more than 35% marks
The pocket expenses (per day) of Anuj, during a certain week, from Monday to Saturday were ₹85.40, ₹88.00, ₹86.50, ₹84.75, ₹82.60 and ₹87.25. Find the mean pocket expenses per day.
The median of first ten even natural numbers is ___________
The median of the following observations arranged in ascending order is 64. Find the value of x:
27, 31, 46, 52, x, x + 4, 71, 79, 85, 90
