Advertisements
Advertisements
प्रश्न
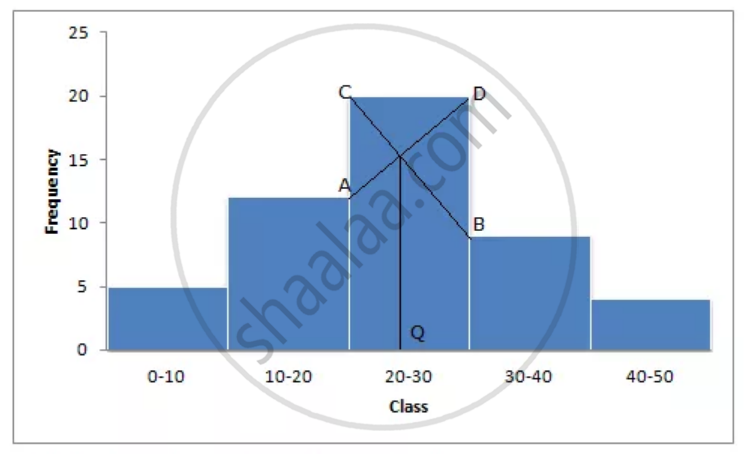
Find the mode of following data, using a histogram:
| Class | 0 – 10 | 10 – 20 | 20 – 30 | 30 – 40 | 40 – 50 |
| Frequency | 5 | 12 | 20 | 9 | 4 |
उत्तर

Mode is in 20 – 30, because in this class there are 20 frequencies.
APPEARS IN
संबंधित प्रश्न
A boy scored following marks in various class tests during a term; each test being marked out of 20.
15, 17, 16, 7, 10, 12, 14, 16, 19, 12 and 16
What are his mean marks?
The mean of the following frequency distribution is 25.8 and the sum of all the frequencies is 50. Find x and y.
| Class | 0-10 | 10-20 | 20-30 | 30-40 | 40-50 |
| Frequency | 7 | x | 15 | y | 10 |
Estimate the median, the lower quartile and the upper quartile of the following frequency distribution by drawing an ogive:
| Marks(more than) | 90 | 80 | 70 | 60 | 50 | 40 | 30 | 20 | 10 | 0 |
| No. of students | 6 | 13 | 22 | 34 | 48 | 60 | 70 | 78 | 80 | 80 |
The median of observations 10, 11, 13, 17, x + 5, 20, 22, 24 and 53 (arranged in ascending order) is 18; find the value of x.
The mean of six numbers: x − 5, x − 1, x, x + 2, x + 4 and x + 12 is 15. Find the mean of first four numbers.
The mean of five numbers is 27. If one number is excluded, the mean of the remaining numbers is 25. Find the excluded number.
Find the median of 5, 7, 9, 11, 15, 17, 2, 23 and 19.
3, 8, 10, x, 14, 16, 18, 20 are in the ascending order and their median is 13. Calculate the numerical value of x.
The median of observation 11, 12, 14, 18, x + 2, x + 4, 30, 32, 35, 41 arranged in ascending order is 24. Find the values of x
If the median of a, 2a, 4a, 6a, 9a is 8, then find the value of a is
