Advertisements
Advertisements
प्रश्न
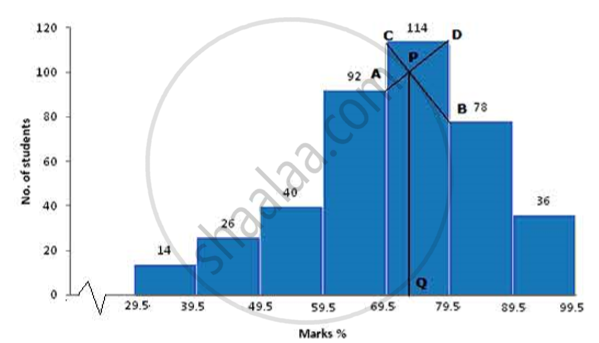
Draw a histogram for the following distribution and estimate the mode:
| Marks% | 30-39 | 40-49 | 50-59 | 60-69 | 70-79 | 80-89 | 90-99 |
| No. of students | 14 | 26 | 40 | 92 | 114 | 78 | 36 |
उत्तर
| Marks % | No. of students |
| 29.5-39.5 | 14 |
| 39.5-49.5 | 26 |
| 49.5-59.5 | 40 |
| 59.5-69.5 | 92 |
| 69.5-79.5 | 114 |
| 79.5-89.5 | 78 |
| 89.5-99.5 | 36 |

(a) Take 1cm = 1 unit and plot marks % on x-axis and no. of students on y-axis.
(b) Draw a bar graph for the given data.
(c) From the histogram it is clear that class 69.5-79.5 has highest frequency i.e. 114
(d) Join the ends of the corresponding frequencies which meet at P and drop a perpendicular on the x-axis from P to Q. Q is the mode. Therefore, Mode = 73
APPEARS IN
संबंधित प्रश्न
The following distribution represents the height of 160 students of a school.
| Height (in cm) | No. of Students |
| 140 – 145 | 12 |
| 145 – 150 | 20 |
| 150 – 155 | 30 |
| 155 – 160 | 38 |
| 160 – 165 | 24 |
| 165 – 170 | 16 |
| 170 – 175 | 12 |
| 175 – 180 | 8 |
Draw an ogive for the given distribution taking 2 cm = 5 cm of height on one axis and 2 cm = 20 students on the other axis. Using the graph, determine:
- The median height.
- The interquartile range.
- The number of students whose height is above 172 cm.
In a malaria epidemic, the number of cases diagnosed were as follows:
| Date July | 1 | 2 | 3 | 4 | 5 | 6 | 7 | 8 | 9 | 10 | 11 | 12 |
| Num | 5 | 12 | 20 | 27 | 46 | 30 | 31 | 18 | 11 | 5 | 0 | 1 |
On what days do the mode and upper and lower quartiles occur?
Find the arithmetic mean (correct to the nearest whole number) by using step-deviation method.
| x | 5 | 10 | 15 | 20 | 25 | 30 | 35 | 40 | 45 | 50 |
| f | 20 | 43 | 75 | 67 | 72 | 45 | 39 | 9 | 8 | 6 |
The heights of 9 persons are 142 cm, 158 cm, 152 cm, 143 cm, 139 cm, 144 cm, 146 cm, 148 cm and 151 cm. Find the mean height.
Find the mean of the following frequency distribution by the step deviation method :
| Class | 0-20 | 20-40 | 40-60 | 60-80 | 80-100 | 100-120 | 120-140 |
| Frequency | 12 | 24 | 52 | 88 | 66 | 42 | 16 |
The mean of a certain number of observations is 32. Find the resulting mean, if the observation is, increased by 60%.
The mean of six numbers: x − 5, x − 1, x, x + 2, x + 4 and x + 12 is 15. Find the mean of first four numbers.
If the mean of 6, 4, 7, p and 10 is 8, find the value of p.
Find the mean of: 3, 1, 5, 4, 4 and 7
Find the median of 17, 23, 36, 12, 18, 23, 40 and 20
