Advertisements
Advertisements
प्रश्न
Draw a histogram for the following distribution and estimate the mode:
| Marks% | 30-39 | 40-49 | 50-59 | 60-69 | 70-79 | 80-89 | 90-99 |
| No. of students | 14 | 26 | 40 | 92 | 114 | 78 | 36 |
उत्तर
| Marks % | No. of students |
| 29.5-39.5 | 14 |
| 39.5-49.5 | 26 |
| 49.5-59.5 | 40 |
| 59.5-69.5 | 92 |
| 69.5-79.5 | 114 |
| 79.5-89.5 | 78 |
| 89.5-99.5 | 36 |
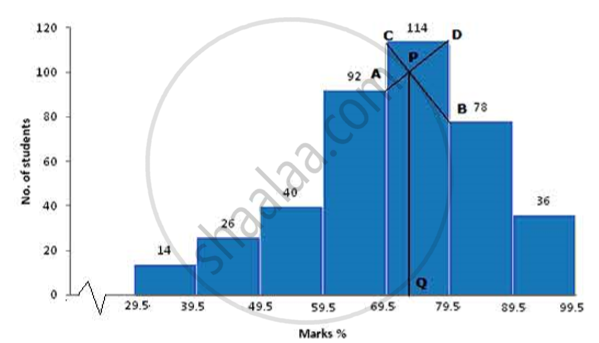
(a) Take 1cm = 1 unit and plot marks % on x-axis and no. of students on y-axis.
(b) Draw a bar graph for the given data.
(c) From the histogram it is clear that class 69.5-79.5 has highest frequency i.e. 114
(d) Join the ends of the corresponding frequencies which meet at P and drop a perpendicular on the x-axis from P to Q. Q is the mode. Therefore, Mode = 73
APPEARS IN
संबंधित प्रश्न
A boy scored following marks in various class tests during a term; each test being marked out of 20.
15, 17, 16, 7, 10, 12, 14, 16, 19, 12 and 16
What are his modal marks?
Draw a histogram and hence estimate the mode for the following frequency distribution:
| Class | 0-10 | 10-20 | 20-30 | 30-40 | 40-50 | 50-60 |
| Freq | 2 | 8 | 10 | 5 | 4 | 3 |
The data on the number of patients attending a hospital in a month are given below. Find the average (mean) number of patients attending the hospital in a month by using the shortcut method. Take the assumed mean as 45. Give your answer correct to 2 decimal places.
| Number of patients | 10 - 20 | 20 - 30 | 30 - 40 | 40 - 50 | 50 - 60 | 60 - 70 |
| Number of Days | 5 | 2 | 7 | 9 | 2 | 5 |
Find the rnedian of the first 15 whole numbers .
Find the mean of 53, 61, 60, 67 and 64.
If the mean of 8, 10, 7, x + 2 and 6 is 9, find the value of x.
Find the median of 3.2, 4.8, 5.6, 5.6, 7.3, 8.9 and 9.1
Find the median of the following sets of numbers.
25, 11, 15, 10, 17, 6, 5, 12.
Find the median of the data: 24, 36, 46, 17, 18, 25, 35
Find the median of the given values : 47, 53, 62, 71, 83, 21, 43, 47, 41
