Advertisements
Advertisements
Question
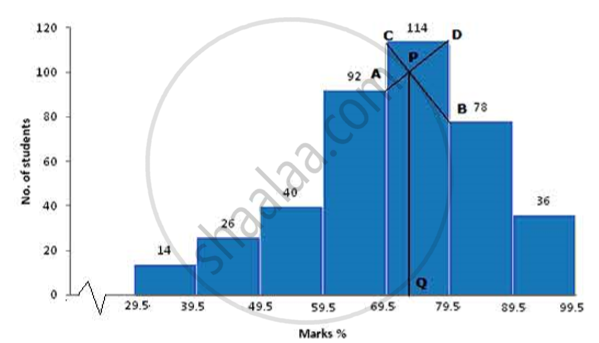
Draw a histogram for the following distribution and estimate the mode:
| Marks% | 30-39 | 40-49 | 50-59 | 60-69 | 70-79 | 80-89 | 90-99 |
| No. of students | 14 | 26 | 40 | 92 | 114 | 78 | 36 |
Solution
| Marks % | No. of students |
| 29.5-39.5 | 14 |
| 39.5-49.5 | 26 |
| 49.5-59.5 | 40 |
| 59.5-69.5 | 92 |
| 69.5-79.5 | 114 |
| 79.5-89.5 | 78 |
| 89.5-99.5 | 36 |

(a) Take 1cm = 1 unit and plot marks % on x-axis and no. of students on y-axis.
(b) Draw a bar graph for the given data.
(c) From the histogram it is clear that class 69.5-79.5 has highest frequency i.e. 114
(d) Join the ends of the corresponding frequencies which meet at P and drop a perpendicular on the x-axis from P to Q. Q is the mode. Therefore, Mode = 73
APPEARS IN
RELATED QUESTIONS
The marks of 200 students in a test were recorded as follows:
| Marks | No. of students |
| 10-19 | 7 |
| 20-29 | 11 |
| 30-39 | 20 |
| 40-49 | 46 |
| 50-59 | 57 |
| 60-69 | 37 |
| 70-79 | 15 |
| 80-89 | 7 |
Construct the cumulative frequency table. Drew the ogive and use it too find:
(1) the median and
(2) the number of student who score more than 35% marks.
If the mean of 8 , 14 , 20 , x and 12 is 13, find x.
Find the mean of the following frequency distribution :
| Class | 0-10 | 10-20 | 20-30 | 30-40 | 40-50 |
| Frequency | 4 | 7 | 6 | 3 | 5 |
Find the mode of the following:
21, 22, 28, 23, 24, 21 26, 22, 29, 27, 21, 21, 26, 24, 23
The marks obtained by 200 students in an examination are given below :
| Marks | 0-10 | 10-20 | 20-30 | 30-40 | 40-50 | 50-60 | 60-70 | 70-80 | 80-90 | 90-100 |
| No.of students | 5 | 10 | 11 | 20 | 27 | 38 | 40 | 29 | 14 | 6 |
Using a graph paper, draw an Ogive for the above distribution. Use your Ogive to estimate:
(i) the median;
(ii) the lower quartile;
(iii) the number of students who obtained more than 80% marks in the examination and
(iv) the number of students who did not pass, if the pass percentage was 35.
Use the scale as 2 cm = 10 marks on one axis and 2 cm = 20 students on the other axis.
The mean of six numbers: x − 5, x − 1, x, x + 2, x + 4 and x + 12 is 15. Find the mean of first four numbers.
The mean of 18, 28, x, 32, 14 and 36 is 23. Find the value of x. Sum of data
Find the median of 17, 23, 36, 12, 18, 23, 40 and 20
Find the median of the 10 observations 36, 33, 45, 28, 39, 45, 54, 23, 56, 25. If another observation 35 is added to the above data, what would be the new median?
Find the median of the given data:
14, −3, 0, −2, −8, 13, −1, 7
