Advertisements
Advertisements
Question
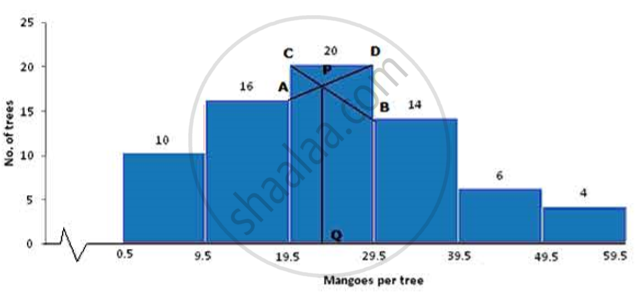
Draw a histogram for the following distribution and estimate the mode:
| Mangoes | 0-9 | 10-19 | 20-29 | 30-39 | 40-49 | 50-59 |
| No. of trees | 10 | 16 | 20 | 14 | 6 | 4 |
Solution
| Mangoes per tree | No. of trees |
| 0.5-9.5 | 10 |
| 9.5-19.5 | 16 |
| 19.5-29.5 | 20 |
| 29.5-39.5 | 14 |
| 39.5-49.5 | 6 |
| 49.5-59.5 | 4 |

(a) Take 1cm = 1 unit and plot mangoes on x-axis and no. of trees on y-axis.
(b) Draw a bar graph for the given data.
(c) From the histogram it is clear that class 19.5-29.5 has highest frequency i.e. 20
(d) Join the ends of the corresponding frequencies which meet at P and drop a perpendicular on the x-axis from P to Q. Q is the mode.
Therefore, Mode = 23 .5
APPEARS IN
RELATED QUESTIONS
The distribution given below shows the marks obtained by 25 students in an aptitude test. Find the mean, median and mode of the distribution.
| Marks obtained | 5 | 6 | 7 | 8 | 9 | 10 |
| No. of students | 3 | 9 | 6 | 4 | 2 | 1 |
The mean of the number 6, ‘y’, 7, ‘x’ and 14 is 8. Express ‘y’ in terms of ‘x’.
In a malaria epidemic, the number of cases diagnosed were as follows:
| Date July | 1 | 2 | 3 | 4 | 5 | 6 | 7 | 8 | 9 | 10 | 11 | 12 |
| Num | 5 | 12 | 20 | 27 | 46 | 30 | 31 | 18 | 11 | 5 | 0 | 1 |
On what days do the mode and upper and lower quartiles occur?
The mean of the following distribution in 52 and the frequency of class interval 30-40 'f' find f
| C.I | 10-20 | 20-30 | 30-40 | 40-50 | 50-60 | 60-70 | 70-80 |
| freq | 5 | 3 | f | 7 | 2 | 6 | 13 |
Find the mean of all numbers from 7 to 17.
Find the median of the following:
3x, x+5, x+7, x+9, x+11, x+13
Height (in cm) of 7 boys of a locality are 144 cm, 155 cm, 168 cm, 163 cm, 167 cm, 151 cm and 158 cm. Find their mean height.
Find the median of the following sets of numbers.
15, 8, 14, 20, 13, 12, 16
The median of observation 11, 12, 14, 18, x + 2, x + 4, 30, 32, 35, 41 arranged in ascending order is 24. Find the values of x
Find the median of the given data:
14, −3, 0, −2, −8, 13, −1, 7
