Advertisements
Advertisements
प्रश्न
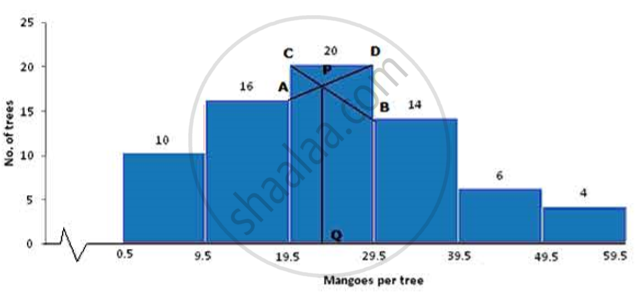
Draw a histogram for the following distribution and estimate the mode:
| Mangoes | 0-9 | 10-19 | 20-29 | 30-39 | 40-49 | 50-59 |
| No. of trees | 10 | 16 | 20 | 14 | 6 | 4 |
उत्तर
| Mangoes per tree | No. of trees |
| 0.5-9.5 | 10 |
| 9.5-19.5 | 16 |
| 19.5-29.5 | 20 |
| 29.5-39.5 | 14 |
| 39.5-49.5 | 6 |
| 49.5-59.5 | 4 |

(a) Take 1cm = 1 unit and plot mangoes on x-axis and no. of trees on y-axis.
(b) Draw a bar graph for the given data.
(c) From the histogram it is clear that class 19.5-29.5 has highest frequency i.e. 20
(d) Join the ends of the corresponding frequencies which meet at P and drop a perpendicular on the x-axis from P to Q. Q is the mode.
Therefore, Mode = 23 .5
APPEARS IN
संबंधित प्रश्न
Draw a histogram from the following frequency distribution and find the mode from the graph:
| Class | 0-5 | 5-10 | 10-15 | 15-20 | 20-25 | 25-30 |
| Frequency | 2 | 5 | 18 | 14 | 8 | 5 |
The mean of the number 6, ‘y’, 7, ‘x’ and 14 is 8. Express ‘y’ in terms of ‘x’.
By drawing an ogive, estimate the median for the following frequency distribution:
| Weight (kg) | 10 – 15 | 15 – 20 | 20 – 25 | 25 – 30 | 30 – 35 |
| No. of boys | 11 | 25 | 12 | 5 | 2 |
The percentage marks obtained in 10 subjects by a student are 84, 88, 72, 91, 68, 75, 98, 96, 79 and 86. Find the median of the marks obtained.
The mean of a certain number of observations is 32. Find the resulting mean, if the observation is, divided by 0.5
If the mean of 8, 10, 7, x + 2 and 6 is 9, find the value of x.
Find the median of 5, 7, 9, 11, 15, 17, 2, 23 and 19.
Find the median of the given data: 35, 25, 34, 36, 45, 18, 28
If the extreme observations on both the ends of a data arranged in ascending order are removed, the median gets affected.
Given below are heights of 15 boys of a class measured in cm:
128, 144, 146, 143, 136, 142, 138, 129, 140, 152, 144, 140, 150, 142, 154
Find the median height of the boys.
