Advertisements
Advertisements
Question
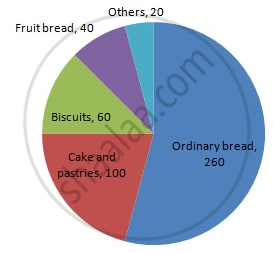
In one day the sales (in rupees) of different items of a baker's shop are given below:
| Items | Ordinary bread | Fruit bread | Cakes and Pastries | Biscuits | Others | Total |
| Sales (in Rs) | 260 | 40 | 100 | 60 | 20 | 480 |
Draw a pie-chart representing the above sales.
Solution
We know:
Central angle of a component = (component value/sum of component values x 360)
Here, total sales = Rs 480
Thus, the central angle for each component can be calculated as follows:
| Item | Sale (in Rs) | Sector angle |
| Ordinary bread | 260 | 260/480 x 360 = 195 |
| Fruit bread | 40 | 40/480 x 360 = 30 |
| Cakes and pastries | 100 | 100/480 x 360 = 75 |
| Biscuits | 60 | 60/480 x 360 = 45 |
| Others | 20 | 20/480 x 360 = 15 |
Now, the pie chat representing the given data can be constructed by following the steps below:
Step 1 : Draw circle of an appropriate radius.
Step 2 : Draw a vertical radius of the circle drawn in step 1.
Step 3 : Choose the largest central angle. Here, the largest central angle is 195o. Draw a sector with the central angle 195o in such a way that one of its radii coincides with the radius drawn in step 2 and another radius is in its counter clockwise direction.
Step 4 : Construct other sectors representing other items in the clockwise direction in the descending order of magnitudes of their central angles.
Step 5 : Shade the sectors with different colours and label them, as shown as in the figure below.
APPEARS IN
RELATED QUESTIONS
Subjectwise marks obtained by a student in an examination are given below
| Subject | Marks |
| Marathi | 85 |
| Hindi | 85 |
| Science | 90 |
| Mathematics | 100 |
| Total | 360 |
Draw pie diagram
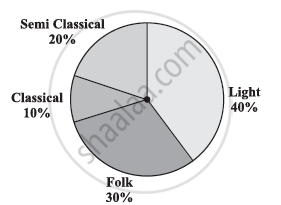
A survey was made to find the type of music that a certain group of young people liked in a city. Adjoining pie chart shows the findings of this survey.
From this pie chart answer the following:
- If 20 people liked classical music, how many young people were surveyed?
- Which type of music is liked by the maximum number of people?
- If a cassette company were to make 1000 CD’s, how many of each type would they make?
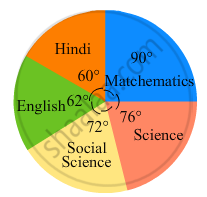
The adjoining pie chart gives the marks scored in an examination by a student in Hindi, English, Mathematics, Social Science and Science. If the total marks obtained by the students were 540, answer the following questions.
- In which subject did the student score 105 marks?
(Hint: For 540 marks, the central angle = 360°. So, for 105 marks, what is the central angle?) - How many more marks were obtained by the student in Mathematics than in Hindi?
- Examine whether the sum of the marks obtained in Social Science and Mathematics is more than that in Science and Hindi.
(Hint: Just study the central angles)

The annual investments of a family are shown in the adjacent pie diagram. Answer the following questions based on it.
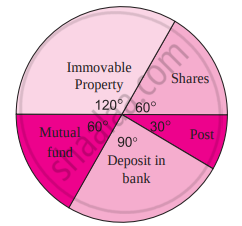
(1) If the investment in shares is ₹ 2000, find the total investment.
(2) How much amount is deposited in the bank?
(3) How much more money is invested in immovable property than in mutual fund?
(4) How much amount is invested in post?
Find the correct answer from the alternatives given.
Different expenditures incurred on the construction of a building were shown by a pie diagram. The expenditure Rs 45,000 on cement was shown by a sector of central angle of 75°. What was the total expenditure of the construction ?
Percentage of the different products of a village in a particular district are given below. Draw a pie-chart representing this information.
| Items | Wheat | Pulses | Jwar | Grounnuts | Vegetables | Total |
| % | `125/3` | `125/6` | `25/2` | `50/3` | `25/3` | 100 |
Following data gives the break up of the cost of production of a book:
| Printing | Paper | Binding charges | Advertisement | Royalty | Miscellaneous |
| 30% | 15% | 15% | 20% | 10% | 15% |
Draw a pie- diagram depicting the above information.
In the following figure, the pie-chart shows the marks obtained by a student in various subjects. If the student scored 135 marks in mathematics, find the total marks in all the subjects. Also, find his score in individual subjects.
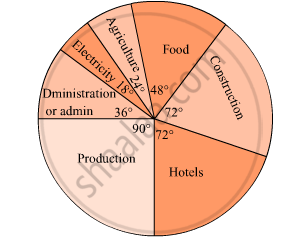
The pie diagram in figure shows the proportions of different workers in a town. Answer the following question with its help.
How many workers are working in the administration ?
The following table shows causes of noise pollution. Show it by a pie diagram.
|
Construction
|
Traffic | Aircraft take offs | Industry | Trains |
| 10% | 50% | 9% | 20% | 11% |
The number of hours, spent by a school boy in different activities in a day is given below :
| Activity | Sleep | School | Play | Homework | Others | Total |
| Number of Hours | 7 | 7 | 2 | 4 | 4 | 24 |
Represent the above information using a pie diagram.
The marks obtained by a student in an examination are given below:
| Subject | Marks |
| Marathi | 85 |
| Hindi | 80 |
| English | 95 |
| Mathematics | 100 |
| Total | 360 |
Represent the data using pie diagram.
Draw a pie-chart for the favourite sweets of your family members
Collect information about the favorite pets of your classmates. Draw bar-graph and pie-chart for the same data
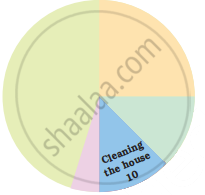
In the EVS period, the teacher asked children whether they help their parents at home. There were different answers. Children named the work in which they help their parents the most. The teacher collected their answers and made a table.
| Help most in housework | Number of children |
| Going to the market | 47 |
| Washing utensils | 15 |
| Washing clothes | 3 |
| Marking serving food | 25 |
| Cleaning the house | 10 |
| Total children who said they help their parents |
Now you can fill the chapati chart to show the numbers given in the table.
Look and find out
Children who help in making or serving food are
Students of a class voted for their favourite colour and a pie chart was prepared based on the data collected.
Observe the pie chart given below and answer questions based on it.
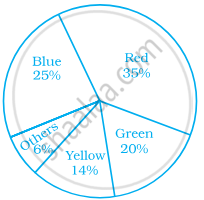
Which of the following is a reasonable conclusion for the given data?
The following data represents the different number of animals in a zoo. Prepare a pie chart for the given data.
| Animals | Number of animals |
| Deer | 42 |
| Elephant | 15 |
| Giraffe | 26 |
| Reptiles | 24 |
| Tiger | 13 |
