Advertisements
Advertisements
Question
The adjoining pie chart gives the marks scored in an examination by a student in Hindi, English, Mathematics, Social Science and Science. If the total marks obtained by the students were 540, answer the following questions.
- In which subject did the student score 105 marks?
(Hint: For 540 marks, the central angle = 360°. So, for 105 marks, what is the central angle?) - How many more marks were obtained by the student in Mathematics than in Hindi?
- Examine whether the sum of the marks obtained in Social Science and Mathematics is more than that in Science and Hindi.
(Hint: Just study the central angles)

Solution
i. Total marks obtained by the student are 540. Hence, 540 marks represent 360º. The central angle for 105 marks has to be calculated.
Central angle for 105 marks = `105/540 xx 360^@ = 70^@`
Hindi is the subject having its central angle as 70º.
Therefore, the student scored 105 marks in Hindi.
ii. Difference between the central angles of Mathematics and Hindi
= 90º − 70º = 20º
Marks for 20º central angle =`20^@/360^@ xx 540 = 30`
There is a difference of 30 marks between the score obtained in Mathematics and Hindi.
Therefore, 30 more marks were obtained by the student in Mathematics than in Hindi.
iii. Marks obtained in Social Science
= Central angle × `"Total mark"/(360°)`
= `65° xx 540/(360°) = 97.5`
Marks obtained in Science
= Central angle × `"Total mark"/(360°)`
= `80° xx 540/(360°) = 120`
So, marks obtained in Social Science and Mathematics
= 97.5 + 135 = 232.5
And marks obtained in Science and Hindi
= 120 + 105 = 225
Thus, (i) and (ii) shows that marks obtained in Mathematics and Social Science is more than that in Science and Hindi.
APPEARS IN
RELATED QUESTIONS
Area under different crops in a certain village is given below. Represent it by a pie diagram :
| Corps | Area (in Hectares) |
| Jowar | 80 |
| Wheat | 20 |
| Sugarcane | 60 |
| Vegetables | 20 |
The sales of salesmen in a week are given in the pie diagram. Study the diagram and answer the following questions. If the total sale due to salesmen A is Rs. 18,000, then
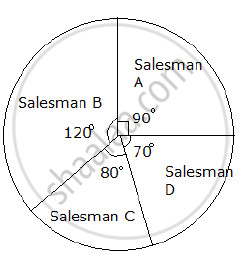
a) Find the total sale.
b) Find the sale of each salesman.
c) Find the salesman with the highest sale.
d) Find the difference between the highest sale and the lowest sale.
The following pie diagram represents the sectorwise loan amount in crores of rupees distributed by a bank. From the information answer the following questions :
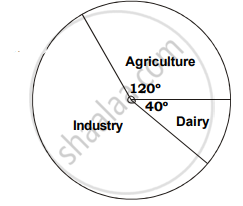
a. If the dairy sector receives `20 crores, then find the total loan disbursed.
b. Find the loan amount for agriculture sector and also for industrial sector.
c. How much additional amount did industrial sector receive than agriculture sector?
The following table shows the percentages of vehicles passing a signal. Find out the measures of central angle to show the information by a pie diagram and hence draw the pie diagram.
| Type of Vehicle | Bicycle | Two wheeler | Car | Bus | Rickshaw |
| Percentage | 10 | 30 | 20 | 20 | 20 |
In one day the sales (in rupees) of different items of a baker's shop are given below:
| Items | Ordinary bread | Fruit bread | Cakes and Pastries | Biscuits | Others | Total |
| Sales (in Rs) | 260 | 40 | 100 | 60 | 20 | 480 |
Draw a pie-chart representing the above sales.
The percentages of various categories of workers in a state are given in the following table.
| Categoies | Culti-vators | Agricultural Labourers | Industrial Workers | Commercial Workers | Others |
| % of workers | 40 | 25 | 12.5 | 10 | 12.5 |
Present the information in the form a pie-chart.
Draw a pie-diagram of the areas of continents of the world given in the following table:
| Continents | Asia | U.S.S.R | Africa | Europe | Noth America | South America | Australia |
| Area (in million sq. km) |
26.9 | 20.5 | 30.3 | 4.9 | 24.3 | 17.9 | 8.5 |
The pie-chart given in the following represents the expenditure on different items in constructing a flat in Delhi. If the expenditure incurred on cement is Rs 112500, find the following:
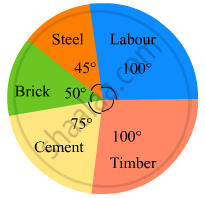
(i) Total cost of the flat.
(ii) Expenditure incurred on labour.
The pie-chart given in the following shows the annual agricultural production of an Indian state. If the total production of all the commodities is 81000 tonnes, find the production (in tonnes) of
(i) Wheat
(ii) Sugar
(iii) Rice
(iv) Maize
(v) Gram

The pie chart (as shown in the figure 25.23) represents the amount spent on different sports by a sports club in a year. If the total money spent by the club on sports is Rs 1,08,000, find the amount spent on each sport.

The following table shows the daily supply of electricity to different places in a town. To show the information by a pie diagram, measures of central angles of sectors are to be decided.
Complete the following activity to find the measure :
| Places |
Supply of electricity |
Measure of central angle |
| Roads | 4 | `4/30 xx 360 = 48^circ` |
| Factories | 12 | `square/square xx 360 = 144^circ` |
| shops | 6 | `6/30 xx 360 = square` |
| Houses | 8 | `square/square xx 360 = square` |
| Total ⇒ | 30 | `square` |
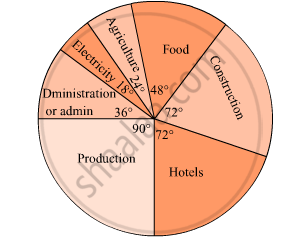
The pie diagram in figure shows the proportions of different workers in a town. Answer the following question with its help.
How many workers are working in the administration ?
Observe the adjacent pie diagram. It shows the percentages of number of vehicles passing a signal in a town between 8 am and 10 am
(1) Find the central angle for each type of vehicle.
(2) If the number of two-wheelers is 1200, find the number of all vehicles.

The following table shows causes of noise pollution. Show it by a pie diagram.
|
Construction
|
Traffic | Aircraft take offs | Industry | Trains |
| 10% | 50% | 9% | 20% | 11% |
Subjective marks obtained by a student in an examination are given below:
| Subject | Marks |
| Marathi | 85 |
| English | 90 |
| Science | 85 |
| Mathematics | 100 |
| Total | 360 |
Draw a pie diagram to represent the above data.
The marks obtained by a student in an examination are given below:
| Subject | Marks |
| Marathi | 85 |
| Hindi | 80 |
| English | 95 |
| Mathematics | 100 |
| Total | 360 |
Represent the data using pie diagram.
| ordinary bread | 320 |
| fruit bread | 80 |
| cakes and pastries | 160 |
| biscuits | 120 |
| others | 40 |
|
Total
|
720 |
In the EVS period, the teacher asked children whether they help their parents at home. There were different answers. Children named the work in which they help their parents the most. The teacher collected their answers and made a table.
| Help most in housework | Number of children |
| Going to the market | 47 |
| Washing utensils | 15 |
| Washing clothes | 3 |
| Marking serving food | 25 |
| Cleaning the house | 10 |
| Total children who said they help their parents |
Now you can fill the chapati chart to show the numbers given in the table.
Monthly salary of a person is Rs. 15000. The central angle of the sector representing his expenses on food and house rent on a pie chart is 60°. The amount he spends on food and house rent is ______.
What is the central angle of the sector representing hormones enzymes and other proteins?

