Advertisements
Advertisements
प्रश्न
The adjoining pie chart gives the marks scored in an examination by a student in Hindi, English, Mathematics, Social Science and Science. If the total marks obtained by the students were 540, answer the following questions.
- In which subject did the student score 105 marks?
(Hint: For 540 marks, the central angle = 360°. So, for 105 marks, what is the central angle?) - How many more marks were obtained by the student in Mathematics than in Hindi?
- Examine whether the sum of the marks obtained in Social Science and Mathematics is more than that in Science and Hindi.
(Hint: Just study the central angles)

उत्तर
i. Total marks obtained by the student are 540. Hence, 540 marks represent 360º. The central angle for 105 marks has to be calculated.
Central angle for 105 marks = `105/540 xx 360^@ = 70^@`
Hindi is the subject having its central angle as 70º.
Therefore, the student scored 105 marks in Hindi.
ii. Difference between the central angles of Mathematics and Hindi
= 90º − 70º = 20º
Marks for 20º central angle =`20^@/360^@ xx 540 = 30`
There is a difference of 30 marks between the score obtained in Mathematics and Hindi.
Therefore, 30 more marks were obtained by the student in Mathematics than in Hindi.
iii. Marks obtained in Social Science
= Central angle × `"Total mark"/(360°)`
= `65° xx 540/(360°) = 97.5`
Marks obtained in Science
= Central angle × `"Total mark"/(360°)`
= `80° xx 540/(360°) = 120`
So, marks obtained in Social Science and Mathematics
= 97.5 + 135 = 232.5
And marks obtained in Science and Hindi
= 120 + 105 = 225
Thus, (i) and (ii) shows that marks obtained in Mathematics and Social Science is more than that in Science and Hindi.
APPEARS IN
संबंधित प्रश्न
A group of 360 people were asked to vote for their favourite season from the three seasons rainy, winter and summer.
- Which season got the most votes?
- Find the central angle of each sector.
- Draw a pie chart to show this information.
| Season | No. of votes |
| Summer | 90 |
| Rainy | 120 |
| Winter | 150 |
Find the correct answer from the alternatives given.
Different expenditures incurred on the construction of a building were shown by a pie diagram. The expenditure Rs 45,000 on cement was shown by a sector of central angle of 75°. What was the total expenditure of the construction ?
The following table shows the percentages of vehicles passing a signal. Find out the measures of central angle to show the information by a pie diagram and hence draw the pie diagram.
| Type of Vehicle | Bicycle | Two wheeler | Car | Bus | Rickshaw |
| Percentage | 10 | 30 | 20 | 20 | 20 |
In one day the sales (in rupees) of different items of a baker's shop are given below:
| Items | Ordinary bread | Fruit bread | Cakes and Pastries | Biscuits | Others | Total |
| Sales (in Rs) | 260 | 40 | 100 | 60 | 20 | 480 |
Draw a pie-chart representing the above sales.
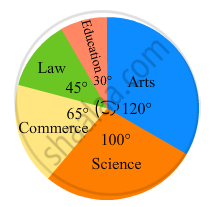
The following pie-chart shows the number of students admitted in different faculties of a college. If 1000 students are admitted in Science answer the following:

(i) What is the total number of students?
(ii) What is the ratio of students in science and arts?
In the following figure, the pie-chart shows the marks obtained by a student in various subjects. If the student scored 135 marks in mathematics, find the total marks in all the subjects. Also, find his score in individual subjects.

The pie chart (as shown in the figure 25.23) represents the amount spent on different sports by a sports club in a year. If the total money spent by the club on sports is Rs 1,08,000, find the amount spent on each sport.

The pie diagram in figure shows the proportions of different workers in a town. Answer the following question with its help.
How many workers are working in the administration ?

The pie diagram in figure shows the proportions of different workers in a town. Answer the following question with its help.
What is the percentage of workers in production ?

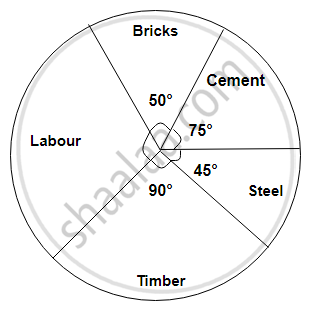
The following diagram represents expenditure on different items in constructing a building.
If the total construction cost of a building is Rs.540000, answer the following questions :
Find the central angle for labour expenditure.

The following diagram represents expenditure on different items in constructing a building.
If the total construction cost of a building is Rs.540000, answer the following questions :
Find the expenditure on labour.

| ordinary bread | 320 |
| fruit bread | 80 |
| cakes and pastries | 160 |
| biscuits | 120 |
| others | 40 |
|
Total
|
720 |
| Age group (in years) |
No. of Persons | Measure of central angle |
| 20 – 25 | 80 | `square/200 xx 360^circ = square` |
| 25 – 30 | 60 | `60/200 xx 360^circ = square` |
| 30 – 35 | 35 | `35/200 xx square = 63^circ` |
| 35 – 40 | 25 | `25/200 xx 360^circ = square` |
| Total | 200 | `square` |
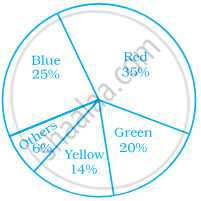
Students of a class voted for their favourite colour and a pie chart was prepared based on the data collected.
Observe the pie chart given below and answer questions based on it.

If 400 students voted in all, then how many did vote ‘Others’ colour as their favourite?
The following pie chart represents the distribution of proteins in parts of a human body. What is the ratio of distribution of proteins in the muscles to that of proteins in the bones?

What is the central angle of the sector representing skin and bones together?

The central angle of a sector in a pie chart cannot be more than 180°.
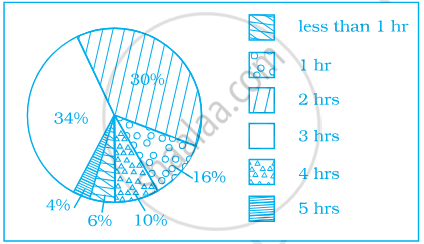
Given below is a pie chart showing the time spend by a group of 350 children in different games. Observe it and answer the questions that follow:

- How many children spend at least one hour in playing games?
- How many children spend more than 2 hours in playing games?
- How many children spend 3 or lesser hours in playing games?
- Which is greater — number of children who spend 2 hours or more per day or number of children who play for less than one hour?
