Advertisements
Advertisements
Question
The pie-chart given in the following shows the annual agricultural production of an Indian state. If the total production of all the commodities is 81000 tonnes, find the production (in tonnes) of
(i) Wheat
(ii) Sugar
(iii) Rice
(iv) Maize
(v) Gram

Solution
(i) \[\text{ Production of wheat }= \frac{\text{ Central angle for wheat }\times\text{ Total production }}{360^\circ}\]
\[ = \frac{120^\circ \times 81000}{360^\circ} = 27000\text{ tonnes }\]
(ii)\[\text{ Production of sugar }= \frac{\text{ Central angle for sugar }\times\text{ Total production }}{360^\circ}\]
\[ = \frac{10^\circ \times 81000}{360^\circ} = 22500\text{ tonnes }\]
(iii) \[\text{ Production of rice }= \frac{\text{ Central angle for Rice }\times\text{ Total production }}{360^\circ}\]
\[ = \frac{60^\circ \times 81000}{360^\circ} = 13500\text{ tonnes }\]
(iv) \[\text{ Production of maize }= \frac{\text{ Central angle for maize }\times\text{ Total production }}{360^\circ}\]
\[ = \frac{30^\circ \times 81000}{360^\circ} = 6750\text{ tonnes }\]
(v) \[\text{ Production of gram }= \frac{\text{ Central angle for Gram }\times\text{ Total production }}{360^\circ}\]
\[ = \frac{120^\circ \times 81000}{360^\circ} = 11250\text{ tonnes }\]
APPEARS IN
RELATED QUESTIONS
Area under different crops in a certain village is given below. Represent it by a pie diagram :
| Corps | Area (in Hectares) |
| Jowar | 80 |
| Wheat | 20 |
| Sugarcane | 60 |
| Vegetables | 20 |
Draw a pie chart showing the following information. The table shows the colours preferred by a group of people.
| Colours | Number of people |
| Blue | 18 |
| Green | 9 |
| Red | 6 |
| Yellow | 3 |
| Total | 36 |
Find the proportion of each sector. For example, blue is `18/36 = 1.2` ; green is `9/36 = 1/4` and so on. Use this to find the corresponding angles.
The pie diagram in figure shows the proportions of different workers in a town. Answer the following question with its help.
If the total workers is 10,000; how many of them are in the field of construction ?
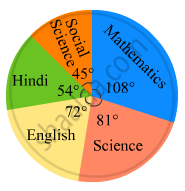
In the following figure, the pie-chart shows the marks obtained by a student in an examination. If the student secures 440 marks in all, calculate his marks in each of the given subjects.

The following table shows the daily supply of electricity to different places in a town. To show the information by a pie diagram, measures of central angles of sectors are to be decided.
Complete the following activity to find the measure :
| Places |
Supply of electricity |
Measure of central angle |
| Roads | 4 | `4/30 xx 360 = 48^circ` |
| Factories | 12 | `square/square xx 360 = 144^circ` |
| shops | 6 | `6/30 xx 360 = square` |
| Houses | 8 | `square/square xx 360 = square` |
| Total ⇒ | 30 | `square` |
The pie diagram in figure shows the proportions of different workers in a town. Answer the following question with its help.
How many workers are working in the administration ?

On an environment day, students in a school planted 120 trees under plantation project. The information regarding the project is shown in the following table. Show it by a pie diagram.
|
Tree name
|
Karanj | Behada | Arjun | Bakul | Kadunimb |
| No. of trees | 20 | 28 | 24 | 22 | 26 |
Subjective marks obtained by a student in an examination are given below:
| Subject | Marks |
| Marathi | 85 |
| English | 90 |
| Science | 85 |
| Mathematics | 100 |
| Total | 360 |
Draw a pie diagram to represent the above data.
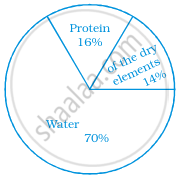
Write down the percentage of content in human body from the given pie-chart.
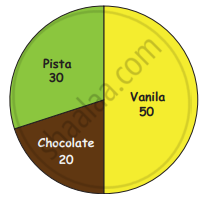
The number of varieties of ice creams in an ice cream parlour is given below as a pie-chart.
(i) How many varieties of Ice creams are there?
(ii) Find the number of Vanilla Ice creams ______.
(iii) Find the total number of Chocolate and Pista Ice cream _______.
(iv) Find the total number of Ice creams _______.
The following pie chart gives the distribution of constituents in the human body. The central angle of the sector showing the distribution of protein and other constituents is ______.

The following pie chart represents the distribution of proteins in parts of a human body. What is the ratio of distribution of proteins in the muscles to that of proteins in the bones?

Data represented using circles is known as ______.
In a pie chart a whole circle is divided into sectors.
The central angle of a sector in a pie chart cannot be more than 180°.
In a pie chart two or more central angles can be equal.
Study the pie chart given below depicting the marks scored by a student in an examination out of 540. Find the marks obtained by him in each subject.

The following data represents the different number of animals in a zoo. Prepare a pie chart for the given data.
| Animals | Number of animals |
| Deer | 42 |
| Elephant | 15 |
| Giraffe | 26 |
| Reptiles | 24 |
| Tiger | 13 |
Identify which symbol should appear in each sector.

