Advertisements
Advertisements
Question
In a pie chart two or more central angles can be equal.
Options
True
False
Solution
This statement is True.
Explanation:
Yes, in a pie chart two or more central angles can be equal.
APPEARS IN
RELATED QUESTIONS
The annual investments of a family are shown in the adjacent pie diagram. Answer the following questions based on it.
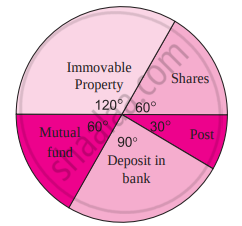
(1) If the investment in shares is ₹ 2000, find the total investment.
(2) How much amount is deposited in the bank?
(3) How much more money is invested in immovable property than in mutual fund?
(4) How much amount is invested in post?
Find the correct answer from the alternatives given.
Different expenditures incurred on the construction of a building were shown by a pie diagram. The expenditure Rs 45,000 on cement was shown by a sector of central angle of 75°. What was the total expenditure of the construction ?
Employees of a company have been categorized according to their religions as given below:
| Religions | Hindu | Muslim | Sikh | Christian | Total |
| Number of workers | 420 | 300 | 225 | 105 | 1080 |
Draw a pie-chart to represent the above information.
Draw a pie-diagram for the following data of expenditure pattern in a family:
| Items | Food | Clothing | Rent | Education | Unforeseen events | Midicine |
| Expenditure (in percent) | 40% | 20% | 10% | 10% | 15% | 5% |
The following data gives the amount spent on the construction of a house. Draw a pie diagram.
| Items | Cement | Timber | Bricks | Labour | Steel | Miscellaneous |
| Expenditure (in thousand Rs) |
60 | 30 | 45 | 75 | 45 | 45 |
The following table shows how a student spends his pocket money during the course of a month. Represent it by a pie-diagram.
| Items | Food | Entertainment | Other expenditure | Savings |
| Expenditure | 40% | 25% | 20% | 15% |
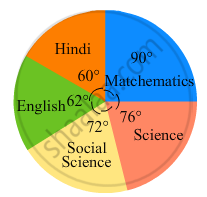
In the following figure, the pie-chart shows the marks obtained by a student in various subjects. If the student scored 135 marks in mathematics, find the total marks in all the subjects. Also, find his score in individual subjects.
The pie chart (as shown in the figure 25.23) represents the amount spent on different sports by a sports club in a year. If the total money spent by the club on sports is Rs 1,08,000, find the amount spent on each sport.

The following table shows causes of noise pollution. Show it by a pie diagram.
|
Construction
|
Traffic | Aircraft take offs | Industry | Trains |
| 10% | 50% | 9% | 20% | 11% |
A survey of students was made to know which game they like. The data obtained in the survey is presented in the adjacent pie diagram. If the total number of students are 1000,
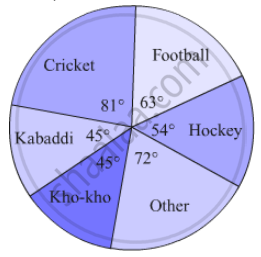
(1) How many students like cricket ?
(2) How many students like football ?
(3) How many students prefer other games ?
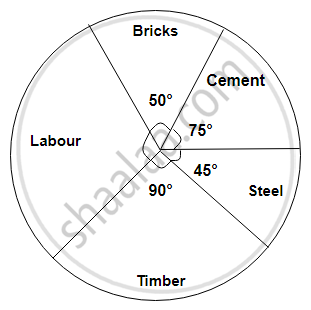
The following diagram represents expenditure on different items in constructing a building.
If the total construction cost of a building is Rs.540000, answer the following questions :
Find the central angle for labour expenditure.
| ordinary bread | 320 |
| fruit bread | 80 |
| cakes and pastries | 160 |
| biscuits | 120 |
| others | 40 |
|
Total
|
720 |
Write down the percentage of content in human body from the given pie-chart.
Absentees record of a class of 30 children is given in a graph.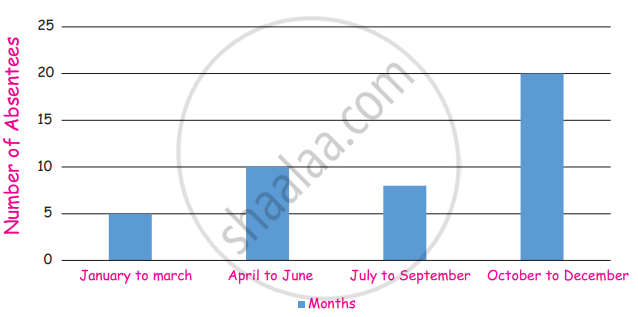
(i) In which month there are more absentees?
(ii) In which month there are less absentees?
Rahul, Varun and Yash are playing a game of spinning a coloured wheel. Rahul wins if spinner lands on red. Varun wins if spinner lands on blue and Yash wins if it lands on green. Which of the following spinner should be used to make the game fair?
The following pie chart gives the distribution of constituents in the human body. The central angle of the sector showing the distribution of protein and other constituents is ______.
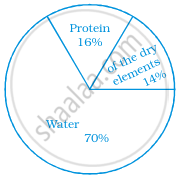
What is the central angle of the sector representing hormones enzymes and other proteins?

The pie chart on the right shows the result of a survey carried out to find the modes of travel used by the children to go to school. Study the pie chart and answer the questions that follow.
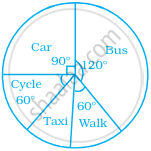
- What is the most common mode of transport?
- What fraction of children travel by car?
- If 18 children travel by car, how many children took part in the survey?
- How many children use taxi to travel to school?
- By which two modes of transport are equal number of children travelling?
A survey was carried out to find the favourite beverage preferred by a certain group of young people. The following pie chart shows the findings of this survey.
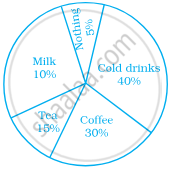
From this pie chart answer the following:
- Which type of beverage is liked by the maximum number of people.
- If 45 people like tea, how many people were surveyed?
Following is a pie chart showing the amount spent in rupees (in thousands) by a company on various modes of advertising for a product.
Now answer the following questions.
- Which type of media advertising is the greatest amount of the total?
- Which type of media advertising is the least amount of the total?
- What percent of the total advertising amount is spent on direct mail campaigns?
- What percent of the advertising amount is spent on newspaper and magazine advertisements?
- What media types do you think are included in miscellaneous? Why aren’t those media types given their own category?
- Television
- Newspapers
- Magazines
- Radio
- Business papers
- Direct mail
- Yellow pages
- Outdoor
- Miscellaneous
