Advertisements
Advertisements
प्रश्न
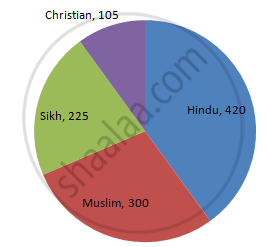
Employees of a company have been categorized according to their religions as given below:
| Religions | Hindu | Muslim | Sikh | Christian | Total |
| Number of workers | 420 | 300 | 225 | 105 | 1080 |
Draw a pie-chart to represent the above information.
उत्तर
We know:
Central angle of a component = (component value / sum of component values × 360ο)
Here, total number of workers = 1050
Thus, the central angle for each component can be calculated as follows:
| Religion | Number of workers | Sector angle |
| Hindu | 420 | 420/1050 × 360 = 144 |
| Muslim | 300 | 300/1050 × 360 = 102.9 |
| Sikh | 225 | 225/1050 × 360 = 77.14 |
| Christian | 105 | 105/1050 × 360 = 36 |
Note: The total number of workers is 1050, not 1080.
Now, the pie chat that represents the given data can be constructed by following the steps below:
Step 1 : Draw circle of an appropriate radius.
Step 2 : Draw a vertical radius of the circle drawn in step 1.
Step 3 : Choose the largest central angle. Here, the largest central angle is 144o. Draw a sector with the central angle 144o in such a way that one of its radii coincides with the radius drawn in step 2 and another radius is in its counter clockwise direction.
Step 4 : Construct other sectors representing other items in the clockwise direction in the descending order of magnitudes of their central angles.
Step 5 : Shade the sectors with different colours and label them as shown as in the figure below.
APPEARS IN
संबंधित प्रश्न
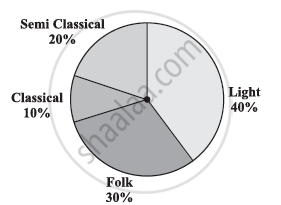
A survey was made to find the type of music that a certain group of young people liked in a city. Adjoining pie chart shows the findings of this survey.
From this pie chart answer the following:
- If 20 people liked classical music, how many young people were surveyed?
- Which type of music is liked by the maximum number of people?
- If a cassette company were to make 1000 CD’s, how many of each type would they make?
The number of students in a hostel speaking different languages is given below. Display the data in a pie chart.
| Language | Hindi | English | Marathi | Tamil | Bengali | Total |
| Number of students | 40 | 12 | 9 | 7 | 4 | 72 |
The marks obtained by a student in different subjects are shown. Draw a pie diagram showing the information.
| Subject | English | Marathi | Science | Mathematics | Social science | Hindi |
| Marks | 50 | 70 | 80 | 90 | 60 | 50 |
In a tree plantation programme, the number of trees planted by students of different classes is given in the following table. Draw a pie diagram showing the information.
| Standard | 5th | 6th | 7th | 8th | 9th | 10th |
| No. of trees | 40 | 50 | 75 | 50 | 70 | 75 |
The following data shows the expenditure of a person on different items during a month. Represent the data by a pie-chart.
| Items of expenditure | Rent | Education | Food | Clothing | Others |
| Amount (in Rs) | 2700 | 1800 | 2400 | 1500 | 2400 |
The percentages of various categories of workers in a state are given in the following table.
| Categoies | Culti-vators | Agricultural Labourers | Industrial Workers | Commercial Workers | Others |
| % of workers | 40 | 25 | 12.5 | 10 | 12.5 |
Present the information in the form a pie-chart.
The following table shows how a student spends his pocket money during the course of a month. Represent it by a pie-diagram.
| Items | Food | Entertainment | Other expenditure | Savings |
| Expenditure | 40% | 25% | 20% | 15% |
Draw a pie-diagram representing the relative frequencies (expressed as percentage) of the eight classes as given below:
12.6, 18.2, 17.5, 20.3, 2.8, 4.2, 9.8, 14.7
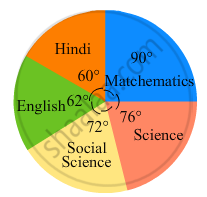
In the following figure, the pie-chart shows the marks obtained by a student in various subjects. If the student scored 135 marks in mathematics, find the total marks in all the subjects. Also, find his score in individual subjects.
The following pie-chart shows the monthly expenditure of Shikha on various items. If she spends Rs 16000 per month, answer the following questions:

(i) How much does she spend on rent?
(ii) How much does she spend on education?
(iii) What is the ratio of expenses on food and rent?
On an environment day, students in a school planted 120 trees under plantation project. The information regarding the project is shown in the following table. Show it by a pie diagram.
|
Tree name
|
Karanj | Behada | Arjun | Bakul | Kadunimb |
| No. of trees | 20 | 28 | 24 | 22 | 26 |
Subjective marks obtained by a student in an examination are given below:
| Subject | Marks |
| Marathi | 85 |
| English | 90 |
| Science | 85 |
| Mathematics | 100 |
| Total | 360 |
Draw a pie diagram to represent the above data.
Absentees record of a class of 30 children is given in a graph.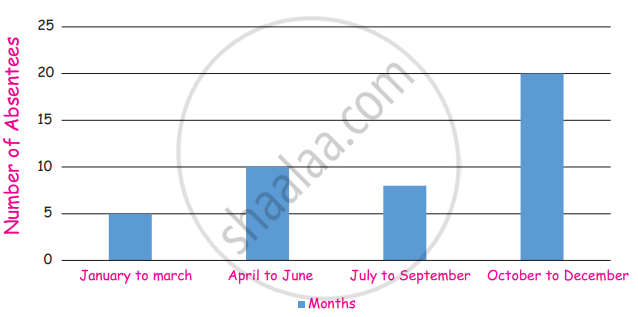
(i) In which month there are more absentees?
(ii) In which month there are less absentees?
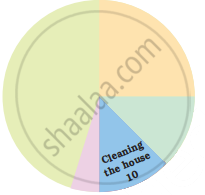
Look and find out
Children who help in making or serving food are
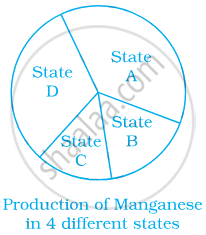
In a pie chart a whole circle is divided into sectors.
From the given pie chart, we can infer that production of Manganese is least in state B.
The following pie chart depicts the expenditure of a state government under different heads.
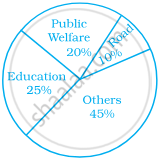
- If the total spending is 10 crores, how much money was spent on roads?
- How many times is the amount of money spent on education compared to the amount spent on roads?
- What fraction of the total expenditure is spent on both roads and public welfare together?
A survey was carried out to find the favourite beverage preferred by a certain group of young people. The following pie chart shows the findings of this survey.
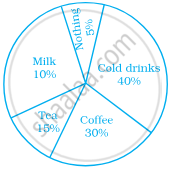
From this pie chart answer the following:
- Which type of beverage is liked by the maximum number of people.
- If 45 people like tea, how many people were surveyed?
Identify which symbol should appear in each sector.