Advertisements
Advertisements
प्रश्न
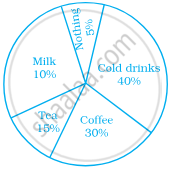
A survey was carried out to find the favourite beverage preferred by a certain group of young people. The following pie chart shows the findings of this survey.

From this pie chart answer the following:
- Which type of beverage is liked by the maximum number of people.
- If 45 people like tea, how many people were surveyed?
उत्तर
i. The percentage of people preferring cold drinks is maximum.
So, cold drinks is liked by the maximum number of people.
ii. From the pie chart, number of people who like tea = 45
⇒ 15% of total number of people surveyed = 45
⇒ `15/100` × Total number of people surveyed = 45
∴ Total number of people surveyed = `(45 xx 100)/15` = 300
APPEARS IN
संबंधित प्रश्न
Draw a pie chart showing the following information. The table shows the colours preferred by a group of people.
| Colours | Number of people |
| Blue | 18 |
| Green | 9 |
| Red | 6 |
| Yellow | 3 |
| Total | 36 |
Find the proportion of each sector. For example, blue is `18/36 = 1.2` ; green is `9/36 = 1/4` and so on. Use this to find the corresponding angles.
The number of students in a hostel speaking different languages is given below. Display the data in a pie chart.
| Language | Hindi | English | Marathi | Tamil | Bengali | Total |
| Number of students | 40 | 12 | 9 | 7 | 4 | 72 |
The following data shows the expenditure of a person on different items during a month. Represent the data by a pie-chart.
| Items of expenditure | Rent | Education | Food | Clothing | Others |
| Amount (in Rs) | 2700 | 1800 | 2400 | 1500 | 2400 |
Draw a pie-diagram for the following data of expenditure pattern in a family:
| Items | Food | Clothing | Rent | Education | Unforeseen events | Midicine |
| Expenditure (in percent) | 40% | 20% | 10% | 10% | 15% | 5% |
The following table shows how a student spends his pocket money during the course of a month. Represent it by a pie-diagram.
| Items | Food | Entertainment | Other expenditure | Savings |
| Expenditure | 40% | 25% | 20% | 15% |
Draw a pie-diagram representing the relative frequencies (expressed as percentage) of the eight classes as given below:
12.6, 18.2, 17.5, 20.3, 2.8, 4.2, 9.8, 14.7
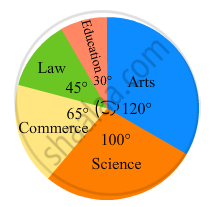
The following pie-chart shows the number of students admitted in different faculties of a college. If 1000 students are admitted in Science answer the following:

(i) What is the total number of students?
(ii) What is the ratio of students in science and arts?
The following pie-chart shows the monthly expenditure of Shikha on various items. If she spends Rs 16000 per month, answer the following questions:

(i) How much does she spend on rent?
(ii) How much does she spend on education?
(iii) What is the ratio of expenses on food and rent?
The number of hours, spent by a school boy in different activities in a day is given below :
| Activity | Sleep | School | Play | Homework | Others | Total |
| Number of Hours | 7 | 7 | 2 | 4 | 4 | 24 |
Represent the above information using a pie diagram.
Write down the percentage of content in human body from the given pie-chart.
Draw a pie-chart for the favourite sweets of your family members
Collect information about the favorite pets of your classmates. Draw bar-graph and pie-chart for the same data
In a pie chart, the total angle at the centre of the circle is ______.
Students of a class voted for their favourite colour and a pie chart was prepared based on the data collected.
Observe the pie chart given below and answer questions based on it.

Which colour received `1/5` of the votes?
In a pie chart a whole circle is divided into sectors.
In a pie chart two or more central angles can be equal.
From the given pie chart, we can infer that production of Manganese is least in state B.

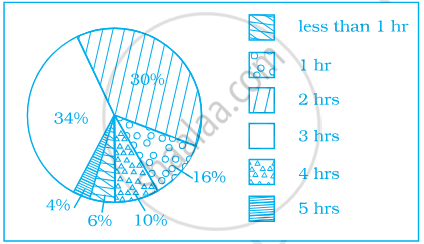
Given below is a pie chart showing the time spend by a group of 350 children in different games. Observe it and answer the questions that follow:

- How many children spend at least one hour in playing games?
- How many children spend more than 2 hours in playing games?
- How many children spend 3 or lesser hours in playing games?
- Which is greater — number of children who spend 2 hours or more per day or number of children who play for less than one hour?
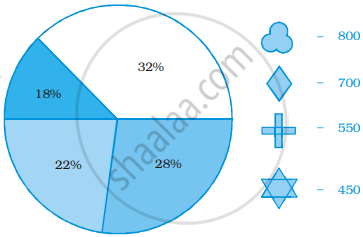
Identify which symbol should appear in each sector.

