Advertisements
Advertisements
प्रश्न
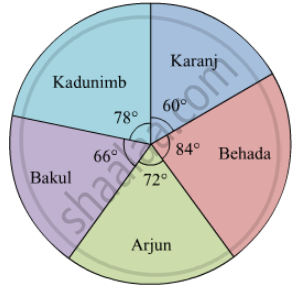
On an environment day, students in a school planted 120 trees under plantation project. The information regarding the project is shown in the following table. Show it by a pie diagram.
|
Tree name
|
Karanj | Behada | Arjun | Bakul | Kadunimb |
| No. of trees | 20 | 28 | 24 | 22 | 26 |
उत्तर
Total number of trees planted = 120
Measure of central angle (θ) = `"Number of scores in the components"/"Total number of scores" × 360°`
| Tree Name | Number of tress | Central Angle |
| Karanj | 20 | `20/120×360=60°` |
| Behada | 28 | `28/120×360=84°` |
| Arjun | 24 | `24/120×360=72°` |
| Bakul | 22 | `22/120×360=66°` |
| Kadunimb | 26 | `26/120×360=78°` |
| Total | 120 | 360° |
The pie digram showing the above data is given below:
APPEARS IN
संबंधित प्रश्न
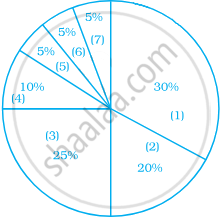
The following pie diagram represents the sectorwise loan amount in crores of rupees distributed by a bank. From the information answer the following questions :
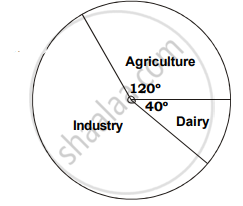
a. If the dairy sector receives `20 crores, then find the total loan disbursed.
b. Find the loan amount for agriculture sector and also for industrial sector.
c. How much additional amount did industrial sector receive than agriculture sector?
The age group and number of persons, who donated blood in a blood donation camp is given below. Draw a pie diagram from it.
|
Age group (Yrs) |
20 - 25 |
25 - 30 |
30 - 35 |
35 - 40 |
|
No. of persons |
80 |
60 |
35 |
25 |
Employees of a company have been categorized according to their religions as given below:
| Religions | Hindu | Muslim | Sikh | Christian | Total |
| Number of workers | 420 | 300 | 225 | 105 | 1080 |
Draw a pie-chart to represent the above information.
In one day the sales (in rupees) of different items of a baker's shop are given below:
| Items | Ordinary bread | Fruit bread | Cakes and Pastries | Biscuits | Others | Total |
| Sales (in Rs) | 260 | 40 | 100 | 60 | 20 | 480 |
Draw a pie-chart representing the above sales.
The percentages of various categories of workers in a state are given in the following table.
| Categoies | Culti-vators | Agricultural Labourers | Industrial Workers | Commercial Workers | Others |
| % of workers | 40 | 25 | 12.5 | 10 | 12.5 |
Present the information in the form a pie-chart.
The following table shows the expenditure incurred by a publisher in publishing a book:
| Items | Paper | Printing | Binding | Advertising | Miscellaneous |
| Expenditure (in%) | 35% | 20% | 10% | 5% | 30% |
Present the above data in the form of a pie-chart.
The following data gives the amount spent on the construction of a house. Draw a pie diagram.
| Items | Cement | Timber | Bricks | Labour | Steel | Miscellaneous |
| Expenditure (in thousand Rs) |
60 | 30 | 45 | 75 | 45 | 45 |
Represent the following data by a pie-diagram:
| Items of expenditure | Expenditure | |
| Family A | Family B | |
| Food | 4000 | 6400 |
| Clothing | 2500 | 480 |
| Rent | 1500 | 3200 |
| Education | 400 | 1000 |
| Miscellaneous | 1600 | 600 |
| Total | 10000 | 16000 |
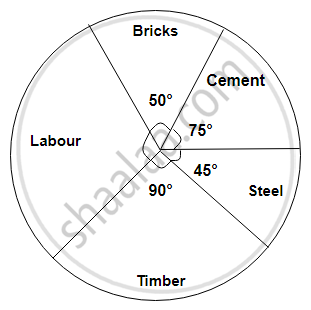
The following diagram represents expenditure on different items in constructing a building.
If the total construction cost of a building is Rs.540000, answer the following questions :
Find the central angle for labour expenditure.
Area under different crops in a certain village is given below. Represent it by pie diagram:
| Crop | Area (in hectare) |
| Jowar | 8000 |
| Wheat | 6000 |
| Sugarcane | 2000 |
| Vegetable | 2000 |
Electricity used by farmers during different parts of a day for irrigation is as follows:
| Party of the day | Morning | Afternoon | Evening | Night |
| percentage of Electricity Used | 30 | 40 | 20 | 10 |
Draw a pie diagram to represent this information.
Data collected in a survey shows that 40% of the buyers are interested in buying a particular brand of toothpaste. The central angle of the sector of the pie chart representing this information is ______.
The following pie chart gives the distribution of constituents in the human body. The central angle of the sector showing the distribution of protein and other constituents is ______.
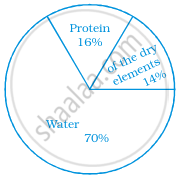
What is the central angle of the sector representing hormones enzymes and other proteins?

The central angle of a sector in a pie chart cannot be more than 180°.
Sum of all the central angles in a pie chart is 360°.
Given below is a pie chart showing the time spend by a group of 350 children in different games. Observe it and answer the questions that follow:
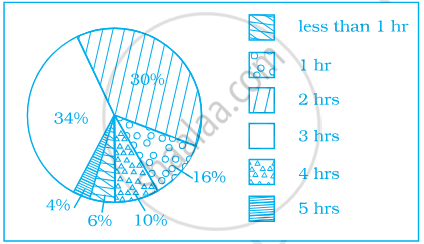
- How many children spend at least one hour in playing games?
- How many children spend more than 2 hours in playing games?
- How many children spend 3 or lesser hours in playing games?
- Which is greater — number of children who spend 2 hours or more per day or number of children who play for less than one hour?
The following data represents the approximate percentage of water in various oceans. Prepare a pie chart for the given data.
| Pacific | 40% |
| Atlantic | 30% |
| Indian | 20% |
| Others | 10% |
A financial counselor gave a client this pie chart describing how to budget his income. If the client brings home Rs. 50,000 each month, how much should he spend in each category?
- Housing
- Food (including eating out)
- Car loan and Maintenance
- Utilities
- Phone
- Clothing
- Entertainment
