Advertisements
Advertisements
Question
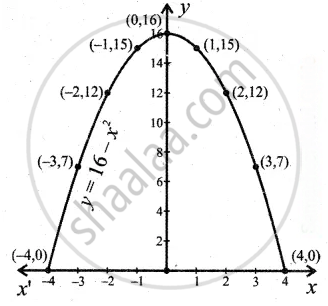
Draw the graph of the following function:
f(x) = 16 – x2
Solution
f(x) = 16 – x2
Let y = f(x) = 16 – x2
Choose suitable values for x and determine y. Thus we get the following table.
| x | -4 | -3 | -2 | -1 | 0 | 1 | 2 | 3 | 4 |
| y | 0 | 7 | 12 | 15 | 16 | 15 | 12 | 7 | 0 |
Plot the points (-4, 0), (-3, 7), (-2, 12), (-1, 15), (0, 16), (1, 15), (2, 12), (3, 7), (4, 0).
The graph is as shown in the figure.

APPEARS IN
RELATED QUESTIONS
Determine whether the following function is odd or even?
f(x) = `((a^x - 1)/(a^x + 1))`
Determine whether the following function is odd or even?
f(x) = `log (x^2 + sqrt(x^2 + 1))`
Let f be defined by f(x) = x3 – kx2 + 2x, x ∈ R. Find k, if ‘f’ is an odd function.
Draw the graph of the following function:
f(x) = x |x|
Draw the graph of the following function:
f(x) = e-2x
If f(x) = `1/(2x + 1)`, x > `-1/2`, then show that f(f(x)) = `(2x + 1)/(2x + 3)`
Draw the graph of y = 9 - x2.
The graph of the line y = 3 is
The minimum value of the function f(x) = |x| is:
f(x) = -5, for all x ∈ R is a:
