Advertisements
Advertisements
Question
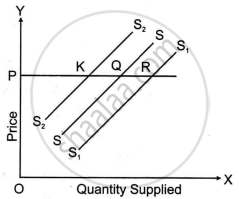
Explain the following diagram.
Solution
The diagram relates to the concept of change in supply.
- SS curve is the original supply curve.
- When supply increases, the supply curve shifts to the right. It is denoted by S1S1 curve. At OP price, supply increases from PQ to PR.
- Supply curve S2S2 indicates the situation of a decrease in supply. The producer is now willing to supply less quantity, i.e., PK, at the same price.
RELATED QUESTIONS
Draw a supply curve.
The continuous rain and lack of fresh supply have affected the availability of tomatoes in India during June - July 2023. What will be the impact on the supply curve for tomatoes?
The year 2023 was celebrated as 'International Year of Millets' and the government decided to subsidize the production of millets. In such case the supply curve will _______.
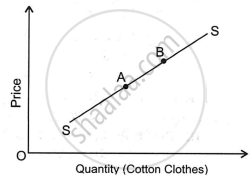
The diagram shows the supply of cotton clothes which of the following would be the case of movement from A to B?
Which of the following does not cause shift of supply curve of a good?
In case of ______, supply curve is a vertical straight line parallel to the Y-axis.
Identify the elasticities of the supply curves given below.
What will the following cause
| Price in Rs. | Quantity supplied in Kgs. |
| 10 | 15 |
| 20 | 40 |
When a straight-line supply curve passes through the origin, the elasticity of supply will be ______.
When a straight-line supply curve cuts the y-axis, the elasticity of supply will be ______.
Draw supply curve of the following situation:
Elasticity of supply = ∞
If the number of firms producing a particular commodity increases, the market supply of that commodity will be ______.
How does an improvement in production technology influence the supply curve of a firm?
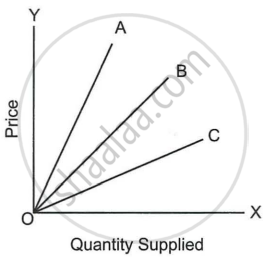
The following diagram shows the supply curve of three commodities. Rank their price elasticity.
Define supply curve.
