Advertisements
Advertisements
Question
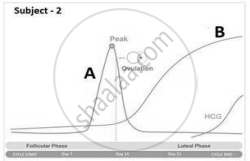
To answer the question, study the graphs below for Subjects 1 and 2 showing different levels of certain hormones.


For subject 2 it is observed that the peak for hormone B has reached the plateau stage. After approximately how much time will the curve for hormone B descend?
Options
28 days
42 days
180 days
280 days
MCQ
Solution
280 days
shaalaa.com
Is there an error in this question or solution?
