Advertisements
Advertisements
Question
From the data given below state which group is more variable, A or B?
|
Marks |
10-20 |
20-30 |
30-40 |
40-50 |
50-60 |
60-70 |
70-80 |
|
Group A |
9 |
17 |
32 |
33 |
40 |
10 |
9 |
|
Group B |
10 |
20 |
30 |
25 |
43 |
15 |
7 |
Solution
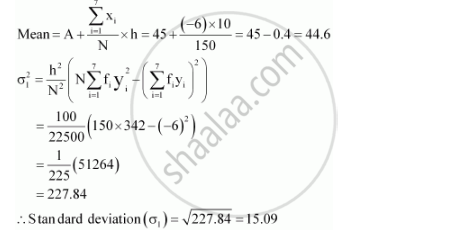
Firstly, the standard deviation of group A is calculated as follows.
| Marks | Group A fi | Mid-point xi | `y_i = (X_i - 45)/10` | yi2 | fiyi | fiyi2 |
|
10-20 |
9 |
15 |
–3 |
9 |
–27 |
81 |
|
20-30 |
17 |
25 |
–2 |
4 |
–34 |
68 |
|
30-40 |
32 |
35 |
–1 |
1 |
–32 |
32 |
|
40-50 |
33 |
45 |
0 |
0 |
0 |
0 |
|
50-60 |
40 |
55 |
1 |
1 |
40 |
40 |
|
60-70 |
10 |
65 |
2 |
4 |
20 |
40 |
|
70-80 |
9 |
75 |
3 |
9 |
27 |
81 |
|
150 |
–6 |
342 |
Here, h = 10, N = 150, A = 45
The standard deviation of group B is calculated as follows.
| Marks |
Group B fi |
Mid-point xi | `y_i = (X_i - 45)/10` | yi2 | fiyi | fiyi2 |
|
10-20 |
10 |
15 |
–3 |
9 |
–30 |
90 |
|
20-30 |
20 |
25 |
–2 |
4 |
–40 |
80 |
|
30-40 |
30 |
35 |
–1 |
1 |
–30 |
30 |
|
40-50 |
25 |
45 |
0 |
0 |
0 |
0 |
|
50-60 |
43 |
55 |
1 |
1 |
43 |
43 |
|
60-70 |
15 |
65 |
2 |
4 |
30 |
60 |
|
70-80 |
7 |
75 |
3 |
9 |
21 |
63 |
|
150 |
–6 |
366 |
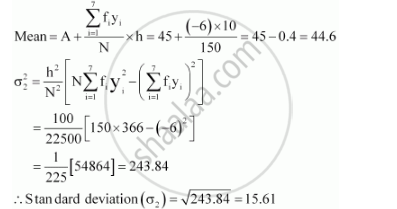
Since the mean of both the groups is same, the group with greater standard deviation will be more variable.
Thus, group B has more variability in the marks.
shaalaa.com
Is there an error in this question or solution?
