Advertisements
Advertisements
Question
From the following distribution, determine median graphically.
| Daily wages (in ₹) | No. of employees |
| Above 300 | 520 |
| Above 400 | 470 |
| Above 500 | 399 |
| Above 600 | 210 |
| Above 700 | 105 |
| Above 800 | 45 |
| Above 900 | 7 |
Solution 1
The given ‘more than cumulative frequency’ table is,
| Daily Wages (in Rs.) |
No. of employee (m.c.f) |
| Above 300 | 520 |
| Above 400 | 470 |
| Above 500 | 399 |
| Above 600 | 210 |
| Above 700 | 105 |
| Above 800 | 45 |
| Above 900 | 7 |
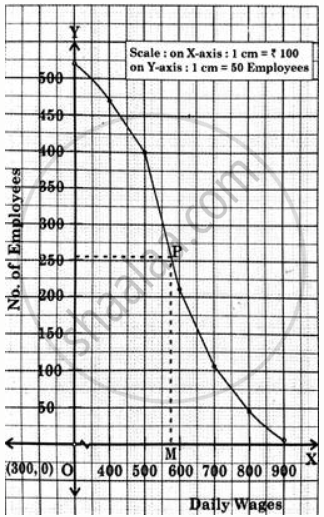
The ‘more than ogive curve’ is plotted using the given lower limit of the class interval (x) against c.f. (y)
For median draw a line parallel to X-axis at Frequency `"N"/(2) = (520)/(2)` = 260
Solution 2
To draw a ogive curve, we construct the less than and more than cumulative frequency table as given below:
| Daily wages (in ₹) | No. of employees (f) |
Less than cumulative frequency (c.f.) |
More than cumulative frequency (c.f.) |
| 300 − 400 | 50 | 50 | 520 |
| 400 − 500 | 71 | 121 | 470 |
| 500 − 600 | 189 | 310 | 399 |
| 600 − 700 | 105 | 415 | 210 |
| 700 − 800 | 60 | 475 | 105 |
| 800 − 900 | 38 | 513 | 45 |
| 900 − 1000 | 7 | 520 | 7 |
| Total | 520 |
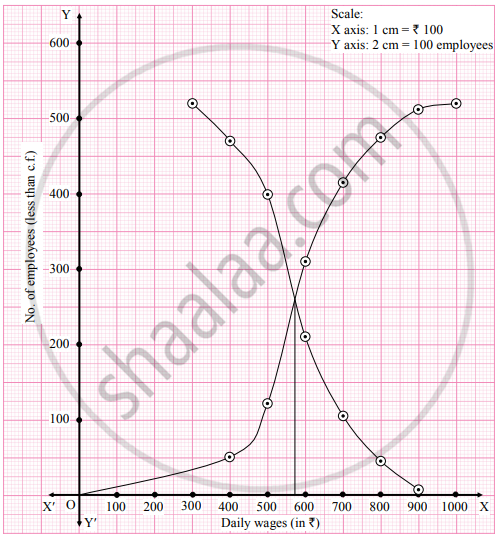
The points to be plotted for less than ogive are (400, 50), (500, 121), (600, 310), (700, 415), (800, 475), (900, 513) and (1000, 520) and that for more than ogive are (300, 520), (400, 470), (500, 399), (600, 210), (700, 105), (800, 45), (900, 7).

From the point of intersection of two ogives, we draw a perpendicular on X-axis.
The point where it meets the X-axis gives the value of the median.
∴ Median ≈ 574
APPEARS IN
RELATED QUESTIONS
The following is the data of pocket expenditure per week of 50 students in a class. It is known that the median of the distribution is ₹120. Find the missing frequencies.
| Expenditure per week (in ₹) |
0 – 50 | 50 – 100 | 100 – 150 | 150 –200 | 200 –250 |
| No. of students | 7 | ? | 15 | ? | 3 |
Find the missing frequency given that the median of the distribution is 1504.
| Life in hours | No. of bulbs |
| 950 – 1150 | 20 |
| 1150 – 1350 | 43 |
| 1350 – 1550 | 100 |
| 1550 – 1750 | - |
| 1750 – 1950 | 23 |
| 1950 – 2150 | 13 |
Ten students appeared for a test in Mathematics and Statistics and they obtained the marks as follows:
| Sr. No. | 1 | 2 | 3 | 4 | 5 | 6 | 7 | 8 | 9 | 10 |
| Marks in Mathematics | 42 | 38 | 36 | 32 | 23 | 25 | 35 | 37 | 25 | 23 |
| Marks in Statistics | 22 | 26 | 29 | 34 | 50 | 45 | 23 | 28 | 32 | 36 |
If the median will be the criteria, in which subject, the level of knowledge of the students is higher?
In a group of 25 students, 7 students failed and 6 students got distinction and the marks of the remaining 12 students are 61, 36, 44, 59, 52, 56, 41, 37, 39, 38, 41, 64. Find the median marks of the whole group.
The median weight of a group of 79 students is found to be 55 kg. 6 more students are added to this group whose weights are 50, 51, 52, 59.5, 60, 61 kg What will be the value of median of the combined group if the lowest and the highest weights were 53 kg and 59 kg respectively?
The median of the following incomplete table is 92. Find the missing frequencies:
| C.I. | 30 – 50 | 50 – 70 | 70 – 90 | 90 – 110 | 110 – 130 | 130 – 150 | Total |
| f | 6 | ? | 18 | 20 | ? | 10 | 80 |
In a college, there are 500 students in junior college, 5% score less than 25 marks, 68 score from 26 to 30 marks, 30% score from 31 to 35 marks, 70 score from 36 to 40 marks, 20% score from 41 to 45 marks and the rest score 46 and above marks. What is the median marks?
