Advertisements
Advertisements
Question
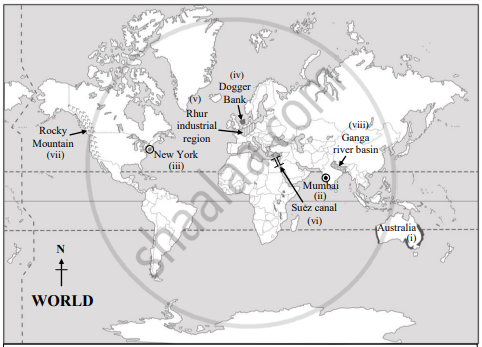
Show the following in the world map. Index is necessary
- High population region in Australia
- A city of India has attraction of migration
- A mega city of USA
- Dogger Bank – fishery centre
- Rhur industrial centre
- The canal which make revolutionary change in ocean transport
- Rocky mountain region
- A major river basin of India
Solution

Index:
 - High population region in Australia
 - A city of India has attraction of migration – Mumbai
 - A mega city of USA New York
 - Dogger Bank – fishery centre
 - Rhur industrial centre
 - The canal which make revolutionary change in ocean transport- Suez canal
 - Rocky mountain region
 - A major river basin of India – Ganga river basin
APPEARS IN
RELATED QUESTIONS
Complete the chain.
| Sr. No. | A | B | C |
| 1. | Australia | Dense equatorial forest | Highest population |
| 2. | Amazon basin | Coastal region | Sparse population area |
| 3. | East America | Desert | High population |
| 4. | India | Permanently snow covered | No residential population |
| 5. | Antarctica | Monsoon climate | Low density |
Give geographical reason
Population density is a function of population and area of a region
Identify the correct group
Social factors affecting on distribution of population:
State whether right or wrong:
Population density is less in equatorial region.
State whether right or wrong:
Population density is high on Tibet plateau.
Complete the statement as per given instruction
Arrange the following countries according to population from high to low.
- Bangladesh
- Russia
- Indonesia
- Mexico
Write a short note on:
The third stage of population transition theory
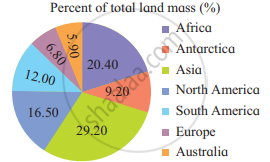
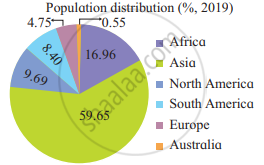
Observe the following diagram and answer the questions given below.
 |
|
- Which continent has the least population?
- Which continent has the least landmass and also the least population?
- Which continent has the most landmass as well as most of the population?
- Which continent is missing in one of the pie charts? Why?
- What is the percentage of population distribution in Asia?
Analyse the effects of geographical factors on the distribution of world population.
Draw diagram and label it.
Expansive age – sex ratio.

