Advertisements
Advertisements
Question
How will you represent first order reactions graphically?
Solution
(i) The differential rate law for the first-order reaction A→P is: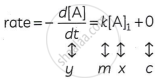
The equation is of the form y = mx + c. A plot of rate versus [A]t is a straight line passing through the origin. The slope of a straight line = k.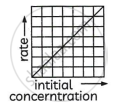
Variation of rate with [A]:
(ii) The integrated rate law is
`k = 2.303/t log_10 [A]_0/[A]_t`
On rearrangement. the equation becomes
`(kt)/2.303 = log_10[A]_0 - log_10[A]_t`
Hence,
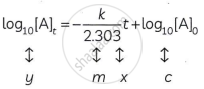
The equation is of the straight line. A graph of log10
`A_0/([A_t]) "versus t gives a straight line with slope" k/2.303` and y-axis intercepts as log10[A]0
A plot showing log `[At]_t/[A]_0` vs time
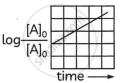
(iii) Rearranging the integrated rate law equation. we get

The equation has a straight-line form y = mx. Hence, the graph of `log_10 [A]_0/[A]_t` versus t is a straight line passing through the origin.

