Advertisements
Advertisements
Question
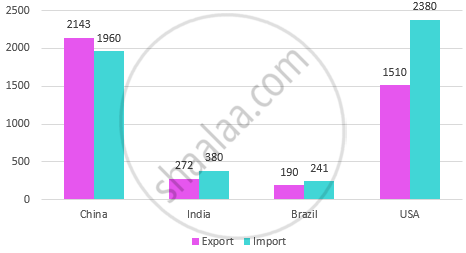
In the following table, export-import of some countries in the year 2014-15 is given in million U.S. dollars. Make a compound bar graph of the given statistical information. Read the bar diagram carefully and comment upon the balance of payments of the respective countries.
| Country | Export | Import |
| China | 2143 | 1960 |
| India | 272 | 380 |
| Brazil | 190 | 241 |
| USA | 1510 | 2380 |
Solution
The bar diagram with comments on the import and export trade is mentioned below.

As per the information provided and the bar diagram India, Brazil and USA are doing an unfavorable balance trade as the value of imports is more than the value of export. Whereas China is doing favourable balance trade as the value of export is more than the value of an import.
APPEARS IN
RELATED QUESTIONS
Write the correct word - Import or Export for the following:
India buys crude oil from the Middle-East Asian countries.
Correct and rewrite the wrong statement:
International trade processes are easier than local trade.
Correct and rewrite the wrong statement:
SAARC works towards economic development and enhancing the social and cultural harmony of the South-East Asian countries.
State the objectives of WTO.
What is the difference between the OPEC and APEC in terms of their functions?
Write the correct word- Import or Export for the following.
Wheat is sent to Asian countries from Canada.
Write the correct word- Import or Export for the following.
Japan sends machine parts to APEC countries.
