Advertisements
Advertisements
Question
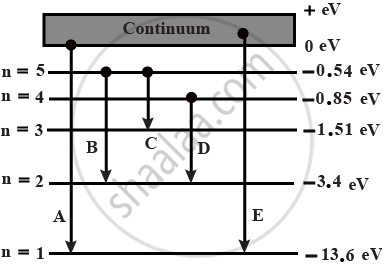
In the given figure, the energy levels of hydrogen atom have been shown along with some transitions marked A, B, C, D and E.
The transitions A, B and C respectively represents

Options
The series limit of Lyman series, third member of balmer series and second member of paschen series.
The first member of the Lyman series, third member of Balmer series and second member of paschen series.
The ionization potential of hydrogen, second member of Balmer series and third member of Paschen series.
The series limit of Lyman series, second member of Balmer series and second member of Paschen series.
Solution
The series limit of Lyman series, third member of balmer series and second member of paschen series.
Explanation:

For transition A,
n1 > 5
n2 = 1
Hence, it is the series limit of lyman series.
For the transition of B,
n1 = 5
n2 = 2
Hence, it represents the third member of balmer series.
For the transition C,
n1 =5
n2 = 3
Hence, it represents the second member of paschen series.
