Advertisements
Advertisements
Question
Interpret the following graph: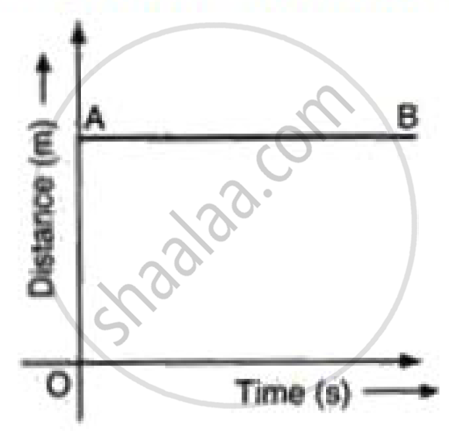
Solution
In distance time graph a straight line parallel to time axis represents state of motion.
APPEARS IN
RELATED QUESTIONS
Derive the following equation of motion by the graphical method : v2 = u2 + 2as, where the symbols have their usual meanings.
Draw a velocity-time graph for the free fall of a body under gravity starting from rest. Take g = 10m s-2
From the displacement-time graph of a cyclist given below in the Figure, find The time after which he reaches the starting point .

Diagram shows a velocity – time graph for a car starting from rest. The graph has three sections AB, BC and CD.

From a study of this graph, state how the distance travelled in any section is determined.
A train starting from rest picks up a speed of 20 ms−1 in 200 s. It continues to move at the same rate for the next 500 s and is then brought to rest in another 100 s.
- Plot a speed-time graph.
- From graph calculate
(a) uniform rate of acceleration
(b) uniform rate of retardation
(c) total distance covered before stopping
(d) average speed.
Draw the speed-time graph of a body starting from some point P, gradually picking up speed, then running at a uniform speed and finally slowing down to stop at some point Q.
Which of the following graphs represents a motion with negative acceleration?
Draw velocity-time graph to show:
Deceleration
Write a sentence to explain the shape of graph.
Figure shows the distance-time graph of three students A, B and C. On the basis of the graph, answer the following :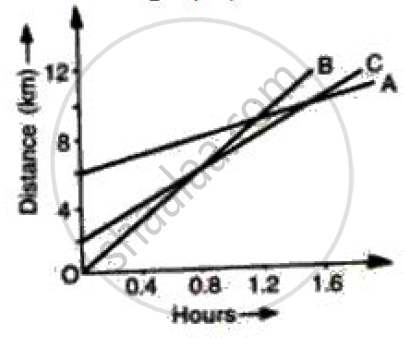
When B meets A, where is C?
Which of the following can determine the acceleration of a moving object.
