Advertisements
Advertisements
Question
Look at the graph in the figure and answer the following questions:

- What does the graph show?
- In which year is the change around 225 mm?
- What conclusions can you draw by seeing the graph?
- What correlation can be seen between this graph and the graph of rising temperatures?
Short Note
Solution
- The graph shows an increase in the global sea level from 1880 till date.
- The change around 225 mm is observed in the year 2018.
- With the continued global warming the sea levels are likely to rise.
- With the rising temperature, the sea level is rising. We can conclude this from both the graphs.
shaalaa.com
Introduction of Global Climate Change
Is there an error in this question or solution?
APPEARS IN
RELATED QUESTIONS
The graph in the figure shows the difference between the global average temperature of the twentieth century and global monthly temperatures from 1985 to 2015. Answer the questions given below:
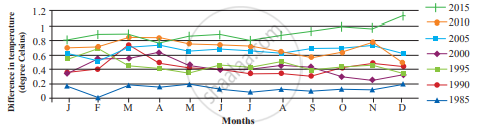
- In which year is the difference the least?
- What is the difference between the mean temperatures of the twentieth century and temperature in 2015?
- Why do the temperatures differ in different months?
Look at the following graph. Answer the following question.
- Which of these gases has the highest contribution?
- Which of these gases come from natural and man-made sources?
- Which activities are responsible for their emission?
- Out of these, whose emissions can be controlled by humans?

Global Greenhouse Gas Emissions
