Advertisements
Advertisements
Question
Non-verbal to verbal
Read the information from the given bar graph and write it in paragraph form.
Answer in Brief
Solution
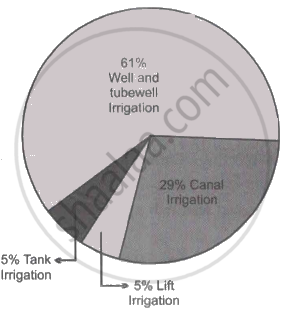
The given pie chart shows information about different sources of irrigation. The chart shows that the maximum, i.e., 61% land is irrigated with the help of wells and tubewells. The farmland which gets irrigated by wells and tubewells has abundant ground water. Besides 29% of agricultural land is irrigated through canals.
Tank and lift irrigation is used to irrigate the remaining 10% of farmland. around 5% of Tank irrigation and lift irrigation each irrigate 5% of the land. The uneven distribution of the various irrigation sources in a region is depicted by the pie chart.
shaalaa.com
Information Transfer
Is there an error in this question or solution?
