Advertisements
Advertisements
Question
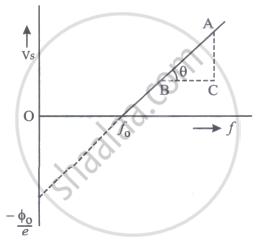
Plot a labelled graph of |Vs| where Vs is stopping potential versus frequency f of the incident radiation. State how will you use this graph to determine the value of Planck's constant?
Numerical
Solution
The graph of stopping potential, |Vs| versus frequency f, of incident radiation is given below:

The value of Plank's constant can be determined, from the above graph as:
h = e, slope of (Vs - f) graph
shaalaa.com
Is there an error in this question or solution?
