Advertisements
Advertisements
Question
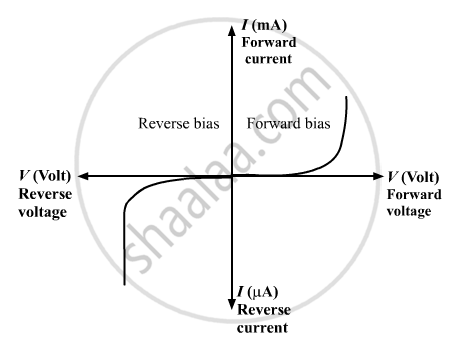
Plot a graph showing variation of current versus voltage for the material GaAs ?
Solution
Current - Voltage characteristics graph for GaAs:

APPEARS IN
RELATED QUESTIONS
Explain the working of P-N junction diode in forward and reverse biased mode.
Show on a graph, the variation of resistivity with temperature for a typical semiconductor.
The plate current in a diode is 20 mA when the plate voltage is 50 V or 60 V. What will be the current if the plate voltage is 70 V?
Diffusion in a p-n junction is due to ______.
A – pn junction has a depletion layer of thickness .of the order of
In the circuit shown in figure, if the diode forward voltage drop is 0.3 V, the voltage difference between A and B is ______.

 (a) |
 (b) |
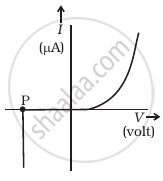
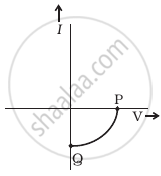
- Name the type of a diode whose characteristics are shown in figure (A) and figure (B).
- What does the point P in figure (A) represent?
- What does the points P and Q in figure (B) represent?
The graph of potential barrier versus width of depletion region for an unbiased diode is shown in graph A. In comparison to A, graphs B and C are obtained after biasing the diode in different ways. Identify the type of biasing in B and C and justify your answer
| ‘A’ | ‘B’ | ‘C’ |
 |
 |
 |
Describe briefly the following term:
breakdown voltage in reverse biasing
Draw a labelled characteristic curve (l-V graph) for a semiconductor diode during forward bias.
