Advertisements
Advertisements
Question
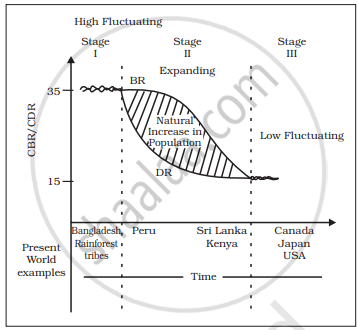
Read the following graph and answer the question
How does the natural increase in population occur, as per the graph?
Options
Birth Rate – Death Rate
Death Rate + Birth Rate
Growth Rate - Birth Rate
Birth Rate + Migration
Solution
Birth Rate – Death Rate
APPEARS IN
RELATED QUESTIONS
Discuss the three stages of demographic transition.
Name a country each from the different stages of demographic transition.
Describe any three characteristics of last stage of Demographic Transition Theory.
Read the following graph and answer the question.
What does the transition from high fluctuating stage to low fluctuating stage indicate?
Read the following graph and answer question.
From the given graph, what condition can you infer about the developing countries?

Why are Fertility and Mortality rates high in the first stage of Demographic Transition Theory?

What led to the decline in Mortality rate in the Second stage of Demographic Transition Theory?

Why does the fertility rate show a declining trend in the third stage of Demographic Transition Theory?

What does the transition from high fluctuating stage to low fluctuating stage indicate?

In which stage of Demographic Transition, is the death rate the highest?
Largest Country in North America continent in terms of area ______
Which of the following is the feature of the last stage of demographic Transition Theory?
Smallest country in North America continent in terms of area ______
Which of the following features is related to the second stage of Demographic Transition Theory?
Study the following two statements and choose the correct option.
Statement-I: In the last stage of demographic transition both fertility and mortality decline considerably.
Statement-II: Resultant population is either stable or grows slowly.
What factors can change the demography of a country?
