Advertisements
Advertisements
Questions
Discuss the three stages of demographic transition.
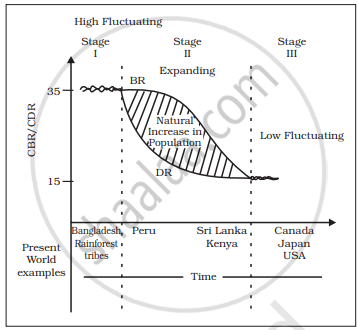
With the help of a neat and labeled diagram, explain the three stages of the Demographic Transition Theory.
Solution

Demographic transition theory can be used to describe and predict the future population of any area. The theory tells us that the population of any region changes from high births and high deaths to low births and low deaths as a society progresses from rural, agrarian and illiterate to urban, industrial and literate society. These changes occur in stages, which are collectively known as the demographic cycle.
The first stage has high fertility and high mortality rates because people reproduce more to compensate for the deaths due to epidemics and variable food supply. Population growth is slow and most people are engaged in agriculture where large families are an asset. Life expectancy is low; people are mostly illiterate and have low levels of technology. Two hundred years ago all the countries were in this stage.
In the second stage, fertility remains high in the beginning, but it declines with time. This is accompanied by reduced mortality rate. Improvements in sanitation and health conditions lead to decline in mortality. Because of this gap the net addition to population is high. This results in population explosion. Eg., Countries like India.
In the last stage, both fertility and mortality decline considerably. The population is either stable or grows slowly. The population becomes urbanized, literate and has high technical know how and deliberately controls the family size. Some countries even face negative growth of population, E.g., many Western European countries.
RELATED QUESTIONS
Name a country each from the different stages of demographic transition.
Describe any three characteristics of last stage of Demographic Transition Theory.
Read the following graph and answer the question
How does the natural increase in population occur, as per the graph?
Read the following graph and answer the question.
What does the transition from high fluctuating stage to low fluctuating stage indicate?
Read the following graph and answer question.
From the given graph, what condition can you infer about the developing countries?

In which stage of Demographic Transition, population explosion took place?

Why are Fertility and Mortality rates high in the first stage of Demographic Transition Theory?

Why does the fertility rate show a declining trend in the third stage of Demographic Transition Theory?

In which stage of Demographic Transition, is the death rate the highest?
Largest Country in North America continent in terms of area ______
Which of the following is the feature of the last stage of demographic Transition Theory?
Smallest country in North America continent in terms of area ______
Which of the following is the main characteristic of the stage-I of Demographic Transition Theory?
Which of the following features is related to the second stage of Demographic Transition Theory?
Study the following two statements and choose the correct option.
Statement-I: In the last stage of demographic transition both fertility and mortality decline considerably.
Statement-II: Resultant population is either stable or grows slowly.
What factors can change the demography of a country?
