Advertisements
Advertisements
Question
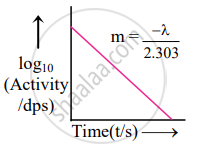
Represent graphically log10 (activity/dps) versus t/s. What is its slope?
Solution
The equation for a decay constant (λ) is given as,
`lambda = 2.303/"t" log_10 "N"_0/"N"` ....(i)
From equation (i),
log10N = `(-lambda)/2.303 "t" + log_10"N"_0`
On comparing with y = mx + c, y = log10N, m = `(-lambda)/2.303`, x = t, c = log10N0
Now, `"N" prop ((- "dN")/"dt")`
Hence, instead if log10N versus t, `log_10((- "dN")/("dt"))` which is log10 (activity) is plotted.
The graph of log10 (activity/dps) versus t/s gives a straight line which can be represented as follows:

Thus, the slope will be `(- lambda)/2.303`.
APPEARS IN
RELATED QUESTIONS
Give an example of mirror nuclei.
Name the most stable nuclide known.
Write pairs of isotones and one pair of mirror nuclei from the following:
\[\ce{^10_5B, ^12_6C, ^27_13Al, ^11_6C, ^28_14S}\]
The atomic mass of \[\ce{^32_16S}\] is 31.97 u. If masses of neutron and H atom are 1.0087 u and 1.0078 u respectively. What is the mass defect?
Find the number of α and β-particles emitted in the process \[\ce{^222_86Rn -> ^214_84Po}\].
