Advertisements
Advertisements
Question
Represent the following data with help of pie-diagram.
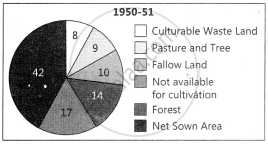
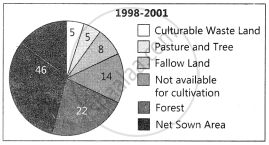
India: Land use 1951-2001
| 1950-51 | 1998-2001 | |
| Net Sown Area | 42 | 46 |
| Forest | 14 | 22 |
| Not available for cultivation | 17 | 14 |
| Fallow Land | 10 | 8 |
| Pasture and Tree | 9 | 5 |
| Cultruable Waste Land | 8 | 5 |
Solution
APPEARS IN
RELATED QUESTIONS
Which one of the following is best suited to represent the decadal growth of population?
Polygraph is constructed to represent:
Which one of the following maps is known as “Dynamic Map”?
What is a thematic map?
Differentiate between multiple bar diagram and compound bar diagram.
Describe the method of constructing a traffic flow map.
Discuss important steps to represent data with help of a pie-diagram.
Represent the following data with the help of a suitable diagram.
India: Trends of Urbanisation 1901-2001
| Year | Decennial growth (%) |
| 1911 | 0.35 |
| 1921 | 8.27 |
| 1931 | 19.12 |
| 1941 | 31.97 |
| 1951 | 41.42 |
| 1961 | 26.41 |
| 1971 | 38.23 |
| 1981 | 46.14 |
| 1991 | 36.47 |
| 20001 | 31.13 |
Represent the following data with the help of suitable diagram.
India: Literacy and Enrolment Ratio in Primary and Upper Primary Schools
| Year | Literacy Ratio |
Enrolment Ratio Primary |
Enrolment Ratio Upper Primary |
||||||
| Person | Male | Female | Boys | Girls | Total | Boys | Girls | Total | |
| 1950-51 | 18.3 | 27.2 | 8.86 | 60.6 | 25 | 42.6 | 20.6 | 4.6 | 12.7 |
| 1999-2000 | 65.4 | 75.8 | 54.2 | 104 | 85 | 94.9 | 67.2 | 50 | 58.8 |
Study the table given below and draw the given diagrams/maps.
Area and Production of Rice in major States
| States | Area in 000 ha | % to total area | Production 000 tones | % to total production |
| West Bengal | 5,435 | 12.3 | 12,428 | 14.6 |
| Uttar Pradesh | 5,839 | 13.2 | 11,540 | 13.6 |
| Andhra Pradesh | 4,028 | 9.1 | 12,428 | 13.5 |
| Punjab | 2,611 | 5.9 | 9,154 | 10.8 |
| Tamil Nadu | 2,113 | 4.8 | 7,218 | 8.5 |
| Bihar | 3,671 | 8.3 | 5,417 | 6.4 |
- Construct a multiple bar diagram to show the area under rice in each State.
- Construct a pie diagram to show the percentage of area under rice in each State.
- Construct a dot map to show the production of rice in each State.
- Construct a Choropleth map to show the percentage of production of rice in States.
Show the following data of temperature and rainfall of Kolkata with a suitable diagram.
| Months | Temperature in º C | Rainfall in cm |
| Jan | 19.6 | 1.2 |
| Feb | 22.0 | 2.8 |
| Mar | 27.1 | 3.4 |
| Apr | 30.1 | 5.1 |
| May | 30.4 | 13.4 |
| June | 29.9 | 29.0 |
| Jul | 28.9 | 33.1 |
| Aug | 28.7 | 33.4 |
| Sep | 28.9 | 25.3 |
| Oct | 27.6 | 12.7 |
| Nov | 23.4 | 2.7 |
| Dec | 19.7 | 0.4 |
