Advertisements
Advertisements
Question
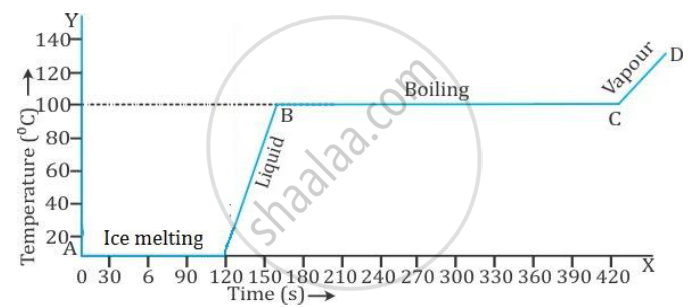
Some ice is heated at a constant rate, and its temperature is recorded after every few seconds, till steam is formed at 100C. Draw a temperature-time graph to represent the change. Label the two-phase changes in your graph.
Solution
The figure for phase change is shown below:
shaalaa.com
Is there an error in this question or solution?
